
- school Campus Bookshelves
- menu_book Bookshelves
- perm_media Learning Objects
- login Login
- how_to_reg Request Instructor Account
- hub Instructor Commons
- Download Page (PDF)
- Download Full Book (PDF)
- Periodic Table
- Physics Constants
- Scientific Calculator
- Reference & Cite
- Tools expand_more
- Readability
selected template will load here
This action is not available.

2.1: Types of Data Representation
- Last updated
- Save as PDF
- Page ID 5696
Two common types of graphic displays are bar charts and histograms. Both bar charts and histograms use vertical or horizontal bars to represent the number of data points in each category or interval. The main difference graphically is that in a bar chart there are spaces between the bars and in a histogram there are not spaces between the bars. Why does this subtle difference exist and what does it imply about graphic displays in general?
Displaying Data
It is often easier for people to interpret relative sizes of data when that data is displayed graphically. Note that a categorical variable is a variable that can take on one of a limited number of values and a quantitative variable is a variable that takes on numerical values that represent a measurable quantity. Examples of categorical variables are tv stations, the state someone lives in, and eye color while examples of quantitative variables are the height of students or the population of a city. There are a few common ways of displaying data graphically that you should be familiar with.
A pie chart shows the relative proportions of data in different categories. Pie charts are excellent ways of displaying categorical data with easily separable groups. The following pie chart shows six categories labeled A−F. The size of each pie slice is determined by the central angle. Since there are 360 o in a circle, the size of the central angle θ A of category A can be found by:

CK-12 Foundation - https://www.flickr.com/photos/slgc/16173880801 - CCSA
A bar chart displays frequencies of categories of data. The bar chart below has 5 categories, and shows the TV channel preferences for 53 adults. The horizontal axis could have also been labeled News, Sports, Local News, Comedy, Action Movies. The reason why the bars are separated by spaces is to emphasize the fact that they are categories and not continuous numbers. For example, just because you split your time between channel 8 and channel 44 does not mean on average you watch channel 26. Categories can be numbers so you need to be very careful.

CK-12 Foundation - https://www.flickr.com/photos/slgc/16173880801 - CCSA
A histogram displays frequencies of quantitative data that has been sorted into intervals. The following is a histogram that shows the heights of a class of 53 students. Notice the largest category is 56-60 inches with 18 people.

A boxplot (also known as a box and whiskers plot ) is another way to display quantitative data. It displays the five 5 number summary (minimum, Q1, median , Q3, maximum). The box can either be vertically or horizontally displayed depending on the labeling of the axis. The box does not need to be perfectly symmetrical because it represents data that might not be perfectly symmetrical.

Earlier, you were asked about the difference between histograms and bar charts. The reason for the space in bar charts but no space in histograms is bar charts graph categorical variables while histograms graph quantitative variables. It would be extremely improper to forget the space with bar charts because you would run the risk of implying a spectrum from one side of the chart to the other. Note that in the bar chart where TV stations where shown, the station numbers were not listed horizontally in order by size. This was to emphasize the fact that the stations were categories.
Create a boxplot of the following numbers in your calculator.
8.5, 10.9, 9.1, 7.5, 7.2, 6, 2.3, 5.5
Enter the data into L1 by going into the Stat menu.

CK-12 Foundation - CCSA
Then turn the statplot on and choose boxplot.

Use Zoomstat to automatically center the window on the boxplot.

Create a pie chart to represent the preferences of 43 hungry students.
- Other – 5
- Burritos – 7
- Burgers – 9
- Pizza – 22

Create a bar chart representing the preference for sports of a group of 23 people.
- Football – 12
- Baseball – 10
- Basketball – 8
- Hockey – 3

Create a histogram for the income distribution of 200 million people.
- Below $50,000 is 100 million people
- Between $50,000 and $100,000 is 50 million people
- Between $100,000 and $150,000 is 40 million people
- Above $150,000 is 10 million people

1. What types of graphs show categorical data?
2. What types of graphs show quantitative data?
A math class of 30 students had the following grades:
3. Create a bar chart for this data.
4. Create a pie chart for this data.
5. Which graph do you think makes a better visual representation of the data?
A set of 20 exam scores is 67, 94, 88, 76, 85, 93, 55, 87, 80, 81, 80, 61, 90, 84, 75, 93, 75, 68, 100, 98
6. Create a histogram for this data. Use your best judgment to decide what the intervals should be.
7. Find the five number summary for this data.
8. Use the five number summary to create a boxplot for this data.
9. Describe the data shown in the boxplot below.

10. Describe the data shown in the histogram below.

A math class of 30 students has the following eye colors:
11. Create a bar chart for this data.
12. Create a pie chart for this data.
13. Which graph do you think makes a better visual representation of the data?
14. Suppose you have data that shows the breakdown of registered republicans by state. What types of graphs could you use to display this data?
15. From which types of graphs could you obtain information about the spread of the data? Note that spread is a measure of how spread out all of the data is.
Review (Answers)
To see the Review answers, open this PDF file and look for section 15.4.
Additional Resources
PLIX: Play, Learn, Interact, eXplore - Baby Due Date Histogram
Practice: Types of Data Representation
Real World: Prepare for Impact
- Reviews / Why join our community?
- For companies
- Frequently asked questions
Data Representation
Literature on data representation.
Here’s the entire UX literature on Data Representation by the Interaction Design Foundation, collated in one place:
Learn more about Data Representation
Take a deep dive into Data Representation with our course AI for Designers .
In an era where technology is rapidly reshaping the way we interact with the world, understanding the intricacies of AI is not just a skill, but a necessity for designers . The AI for Designers course delves into the heart of this game-changing field, empowering you to navigate the complexities of designing in the age of AI. Why is this knowledge vital? AI is not just a tool; it's a paradigm shift, revolutionizing the design landscape. As a designer, make sure that you not only keep pace with the ever-evolving tech landscape but also lead the way in creating user experiences that are intuitive, intelligent, and ethical.
AI for Designers is taught by Ioana Teleanu, a seasoned AI Product Designer and Design Educator who has established a community of over 250,000 UX enthusiasts through her social channel UX Goodies. She imparts her extensive expertise to this course from her experience at renowned companies like UiPath and ING Bank, and now works on pioneering AI projects at Miro.
In this course, you’ll explore how to work with AI in harmony and incorporate it into your design process to elevate your career to new heights. Welcome to a course that doesn’t just teach design; it shapes the future of design innovation.
In lesson 1, you’ll explore AI's significance, understand key terms like Machine Learning, Deep Learning, and Generative AI, discover AI's impact on design, and master the art of creating effective text prompts for design.
In lesson 2, you’ll learn how to enhance your design workflow using AI tools for UX research, including market analysis, persona interviews, and data processing. You’ll dive into problem-solving with AI, mastering problem definition and production ideation.
In lesson 3, you’ll discover how to incorporate AI tools for prototyping, wireframing, visual design, and UX writing into your design process. You’ll learn how AI can assist to evaluate your designs and automate tasks, and ensure your product is launch-ready.
In lesson 4, you’ll explore the designer's role in AI-driven solutions, how to address challenges, analyze concerns, and deliver ethical solutions for real-world design applications.
Throughout the course, you'll receive practical tips for real-life projects. In the Build Your Portfolio exercises, you’ll practise how to integrate AI tools into your workflow and design for AI products, enabling you to create a compelling portfolio case study to attract potential employers or collaborators.
All open-source articles on Data Representation
Visual mapping – the elements of information visualization.

- 3 years ago
Rating Scales in UX Research: The Ultimate Guide

Open Access—Link to us!
We believe in Open Access and the democratization of knowledge . Unfortunately, world-class educational materials such as this page are normally hidden behind paywalls or in expensive textbooks.
If you want this to change , cite this page , link to us, or join us to help us democratize design knowledge !
Privacy Settings
Our digital services use necessary tracking technologies, including third-party cookies, for security, functionality, and to uphold user rights. Optional cookies offer enhanced features, and analytics.
Experience the full potential of our site that remembers your preferences and supports secure sign-in.
Governs the storage of data necessary for maintaining website security, user authentication, and fraud prevention mechanisms.
Enhanced Functionality
Saves your settings and preferences, like your location, for a more personalized experience.
Referral Program
We use cookies to enable our referral program, giving you and your friends discounts.
Error Reporting
We share user ID with Bugsnag and NewRelic to help us track errors and fix issues.
Optimize your experience by allowing us to monitor site usage. You’ll enjoy a smoother, more personalized journey without compromising your privacy.
Analytics Storage
Collects anonymous data on how you navigate and interact, helping us make informed improvements.
Differentiates real visitors from automated bots, ensuring accurate usage data and improving your website experience.
Lets us tailor your digital ads to match your interests, making them more relevant and useful to you.
Advertising Storage
Stores information for better-targeted advertising, enhancing your online ad experience.
Personalization Storage
Permits storing data to personalize content and ads across Google services based on user behavior, enhancing overall user experience.
Advertising Personalization
Allows for content and ad personalization across Google services based on user behavior. This consent enhances user experiences.
Enables personalizing ads based on user data and interactions, allowing for more relevant advertising experiences across Google services.
Receive more relevant advertisements by sharing your interests and behavior with our trusted advertising partners.
Enables better ad targeting and measurement on Meta platforms, making ads you see more relevant.
Allows for improved ad effectiveness and measurement through Meta’s Conversions API, ensuring privacy-compliant data sharing.
LinkedIn Insights
Tracks conversions, retargeting, and web analytics for LinkedIn ad campaigns, enhancing ad relevance and performance.
LinkedIn CAPI
Enhances LinkedIn advertising through server-side event tracking, offering more accurate measurement and personalization.
Google Ads Tag
Tracks ad performance and user engagement, helping deliver ads that are most useful to you.
Share the knowledge!
Share this content on:
or copy link
Cite according to academic standards
Simply copy and paste the text below into your bibliographic reference list, onto your blog, or anywhere else. You can also just hyperlink to this page.
New to UX Design? We’re Giving You a Free ebook!

Download our free ebook The Basics of User Experience Design to learn about core concepts of UX design.
In 9 chapters, we’ll cover: conducting user interviews, design thinking, interaction design, mobile UX design, usability, UX research, and many more!

- FOUNDATION YEARS
- LEARN TO CODE
- ROBOTICS ENGINEERING
- CLASS PROJECTS
- Classroom Discussions
- Useful Links
- PRIVACY POLICY


Digital Humanities Data Curation
This is the first stop on your way to mastering the essentials of data curation for the humanities. The Guide offers concise, expert introductions to key topics, including annotated links to important standards, articles, projects, and other resources.
The best place to start is the Table of Contents grid. To find out more about the project, visit the About This Site page. Please browse, read, and contribute. We’re still expanding the site, but take a look around. Happy browsing!
— The Editors
Follow @DHCuration
More about the DH Curation Guide
Data curation is an emerging problem for the humanities as both data and analytical practices become increasingly digital. Research groups working with cultural content as well as libraries, museums, archives, and other institutions are all in need of new expertise. This Guide is a first step to understanding the essentials of data curation for the humanities. The expert-written introductions to key topics include links to important standards, documentation, articles, and projects in the field, annotated with enough context from expert editors and the research community to indicate to newcomers how these resources might help them with data curation challenges.
A Community Resource
Intended to help students and those new to the field, the DH Curation Guide also provides a quick reference for teachers, administrators, and anyone seeking an orientation in the issues and practicalities of data curation.
As indicated by the name, this community resource guide is intended to be a living, participatory document. Readers are encouraged to review and comment on every part of this guide, to suggest additional resources, and to contribute to stub articles. Contributions from readers are incorporated at intervals to keep the Guide at the cutting edge. Read more about how to contribute
Browse, comment, contribute! The table of contents provides a road map to the Guide’s current topics and those to be added soon. Read more about this site
What Is Data Visualization? Definition, Examples, And Learning Resources
In our increasingly data-driven world, it’s more important than ever to have accessible ways to view and understand data. After all, the demand for data skills in employees is steadily increasing each year. Employees and business owners at every level need to have an understanding of data and of its impact.
That’s where data visualization comes in handy. With the goal of making data more accessible and understandable, data visualization in the form of dashboards is the go-to tool for many businesses to analyze and share information.
In this article, we'll cover:
- The definition of data visualization
- Advantages and disadvantages of data visualization
Why data visualization is important
Data visualization and big data.
- Data visualization examples
- Tools and software of data visualization
- More about data visualization
What is data visualization?
Data visualization is the graphical representation of information and data. By using v isual elements like charts, graphs, and maps , data visualization tools provide an accessible way to see and understand trends, outliers, and patterns in data. Additionally, it provides an excellent way for employees or business owners to present data to non-technical audiences without confusion.
In the world of Big Data, data visualization tools and technologies are essential to analyze massive amounts of information and make data-driven decisions.
What are the advantages and disadvantages of data visualization?
Something as simple as presenting data in graphic format may seem to have no downsides. But sometimes data can be misrepresented or misinterpreted when placed in the wrong style of data visualization. When choosing to create a data visualization, it’s best to keep both the advantages and disadvantages in mind.
Our eyes are drawn to colors and patterns . We can quickly identify red from blue, and squares from circles. Our culture is visual, including everything from art and advertisements to TV and movies. Data visualization is another form of visual art that grabs our interest and keeps our eyes on the message. When we see a chart, we quickly see trends and outliers . If we can see something, we internalize it quickly. It’s storytelling with a purpose. If you’ve ever stared at a massive spreadsheet of data and couldn’t see a trend, you know how much more effective a visualization can be.
Some other advantages of data visualization include:
- Easily sharing information.
- Interactively explore opportunities.
- Visualize patterns and relationships.
Disadvantages
While there are many advantages, some of the disadvantages may seem less obvious. For example, when viewing a visualization with many different datapoints, it’s easy to make an inaccurate assumption. Or sometimes the visualization is just designed wrong so that it’s biased or confusing.
Some other disadvantages include:
- Biased or inaccurate information.
- Correlation doesn’t always mean causation.
- Core messages can get lost in translation.
The importance of data visualization is simple: it helps people see, interact with, and better understand data. Whether simple or complex, the right visualization can bring everyone on the same page, regardless of their level of expertise.
It’s hard to think of a professional industry that doesn’t benefit from making data more understandable . Every STEM field benefits from understanding data—and so do fields in government, finance, marketing, history, consumer goods, service industries, education, sports, and so on.
While we’ll always wax poetically about data visualization (you’re on the Tableau website, after all) there are practical, real-life applications that are undeniable. And, since visualization is so prolific, it’s also one of the most useful professional skills to develop. The better you can convey your points visually, whether in a dashboard or a slide deck, the better you can leverage that information. The concept of the citizen data scientist is on the rise . Skill sets are changing to accommodate a data-driven world. It is increasingly valuable for professionals to be able to use data to make decisions and use visuals to tell stories of when data informs the who, what, when, where, and how.
While traditional education typically draws a distinct line between creative storytelling and technical analysis, the modern professional world also values those who can cross between the two: data visualization sits right in the middle of analysis and visual storytelling.
As the “age of Big Data” kicks into high gear , visualization is an increasingly key tool to make sense of the trillions of rows of data generated every day. Data visualization helps to tell stories by curating data into a form easier to understand, highlighting the trends and outliers. A good visualization tells a story, removing the noise from data and highlighting useful information.
However, it’s not simply as easy as just dressing up a graph to make it look better or slapping on the “info” part of an infographic. Effective data visualization is a delicate balancing act between form and function. The plainest graph could be too boring to catch any notice or it make tell a powerful point; the most stunning visualization could utterly fail at conveying the right message or it could speak volumes. The data and the visuals need to work together, and there’s an art to combining great analysis with great storytelling.
Learn more about big data .
Create beautiful visualizations with your data.
Try Tableau for free

Examples of data visualization
Different types of visualizations.
When you think of data visualization, your first thought probably immediately goes to simple bar graphs or pie charts. While these may be an integral part of visualizing data and a common baseline for many data graphics, the right visualization must be paired with the right set of information. Simple graphs are only the tip of the iceberg . There’s a whole selection of visualization methods to present data in effective and interesting ways.
General Types of Visualizations:
- Chart: Information presented in a tabular, graphical form with data displayed along two axes. Can be in the form of a graph, diagram, or map. Learn more.
- Table: A set of figures displayed in rows and columns. Learn more.
- Graph: A diagram of points, lines, segments, curves, or areas that represents certain variables in comparison to each other, usually along two axes at a right angle.
- Geospatial: A visualization that shows data in map form using different shapes and colors to show the relationship between pieces of data and specific locations. Learn more.
- Infographic: A combination of visuals and words that represent data. Usually uses charts or diagrams.
- Dashboards: A collection of visualizations and data displayed in one place to help with analyzing and presenting data. Learn more.
More specific examples
- Area Map: A form of geospatial visualization, area maps are used to show specific values set over a map of a country, state, county, or any other geographic location. Two common types of area maps are choropleths and isopleths. Learn more.
- Bar Chart: Bar charts represent numerical values compared to each other. The length of the bar represents the value of each variable. Learn more.
- Box-and-whisker Plots: These show a selection of ranges (the box) across a set measure (the bar). Learn more.
- Bullet Graph: A bar marked against a background to show progress or performance against a goal, denoted by a line on the graph. Learn more.
- Gantt Chart: Typically used in project management, Gantt charts are a bar chart depiction of timelines and tasks. Learn more.
- Heat Map: A type of geospatial visualization in map form which displays specific data values as different colors (this doesn’t need to be temperatures, but that is a common use). Learn more.
- Highlight Table: A form of table that uses color to categorize similar data, allowing the viewer to read it more easily and intuitively. Learn more.
- Histogram: A type of bar chart that split a continuous measure into different bins to help analyze the distribution. Learn more.
- Pie Chart: A circular chart with triangular segments that shows data as a percentage of a whole. Learn more.
- Treemap: A type of chart that shows different, related values in the form of rectangles nested together. Learn more.
Visualization tools and software
There are dozens of tools for data visualization and data analysis . These range from simple to complex, from intuitive to obtuse. Not every tool is right for every person looking to learn visualization techniques, and not every tool can scale to industry or enterprise purposes. If you’d like to learn more about the options, feel free to read up here or dive into detailed third-party analysis like the Gartner Magic Quadrant.
Also, remember that good data visualization theory and skills will transcend specific tools and products. When you’re learning this skill, focus on best practices and explore your own personal style when it comes to visualizations and dashboards. Data visualization isn’t going away any time soon, so it’s important to build a foundation of analysis and storytelling and exploration that you can carry with you regardless of the tools or software you end up using.
Learn more about data visualizations
If you’re feeling inspired or want to learn more, there are tons of resources to tap into. Data visualization and data journalism are full of enthusiastic practitioners eager to share their tips, tricks, theory, and more.
Blogs about data visualization
See our list of great data visualization blogs full of examples, inspiration, and educational resources. The experts who write books and teach classes about the theory behind data visualization also tend to keep blogs where they analyze the latest trends in the field and discuss new vizzes. Many will offer critiques on modern graphics or write tutorials to create effective visualizations. Others will collect many different data visualizations from around the web in order to highlight the most intriguing ones. Blogs are a great way to learn more about specific subsets of data visualization or to look for relatable inspiration from well-done projects.
See our list of the best data visualization blogs.
Books about data visualization
Read our list of great books about data visualization theory and practice. While blogs can keep up with the changing field of data visualization, books focus on where the theory stays constant. Humans have been trying to present data in a visual form throughout our entire existence. One of the earlier books about data visualization, originally published in 1983, set the stage for data visualization to come and still remains relevant to this day. More current books still deal with theory and techniques, offering up timeless examples and practical tips. Some even take completed projects and present the visual graphics in book form as an archival display.
See our list of the best data visualization books.
Courses and Training
There are plenty of great paid and free courses and resources on data visualization out there, including right here on the Tableau website. There are videos, articles, and whitepapers for everyone from beginners to data rockstars. When it comes to third-party courses, however, we won’t provide specific suggestions in this article at this time.
Explore Tableau’s trainings.
Additional Resources
10 interactive map and data visualization examples, tips for creating effective, engaging data visualizations.
Data representation: A Comprehensive Overview (2021)

Introduction
The computer is incapable of comprehending human language. Any data fed to a computer, such as letters, symbols, images, audio, videos, and so on, should be converted to machine language first. In this article, we will discuss data representation, binary number representation, pictorial representation of data, graph representation in the data structure, and the importance of graphical representation of data.
- What exactly is Braille?
- Numbers in data representation
- Text in data representation
- Images and Colours in data representation
- Program Instructions in data representation
1. What exactly is Braille?
Braille is a touch-reading and writing device for the blind that uses raised dots to represent the alphabet’s letters. It also includes punctuation mark equivalents as well as symbols that denote letter groupings. Braille is read by moving the hand or hands along each line from left to right. Reading is usually performed with both hands, with the index fingers doing the bulk of the job. Reading pace is about 125 words per minute on average. However, higher speeds of up to 200 words per minute can be reached. People who are blind should review and research the written word using the braille alphabet. They will also learn about writing conventions like spelling, punctuation, paragraphing, and footnotes.
2. Numbers in data representation
We are taught the idea of numbers from a young age. Anything is a number to a machine, including alphabets, images, sounds, and so on. There are four different types of number systems:
- The binary number scheme has only two possible values: 0 or 1.
- The octal number system is used to represent values with eight digits.
- The decimal number system is used to describe values with ten digits.
- The hexadecimal number system uses 16 digits to represent values.
Bits A bit is the smallest unit of data that a machine can understand or use. Bits are typically found as groups in computers.
A byte is an eight-bit group of information. A nibble is described as half a byte.
- The decimal (Base 10) number system has ten symbols. It’s written in positional notation. The least-significant digit (rightmost digit) is of the order of 10^0 (units or ones).
- Binary is a type of data that can (Base 2) The binary number system has two symbols: 0 and 1, which are referred to as bits. It’s a positional notation as well. A binary number will be denoted by the suffix B. Prefix 0b or 0B (e.g., 0b1001000) or prefix b with the bits quoted (e.g., b’10001111′) are used in some programming languages to represent binary numbers.
- Number System in Hexadecimal (Base 16): The hexadecimal number system employs 16 symbols referred to as hex digits. It’s referred to as a positional notation. A hexadecimal number (abbreviated as hex) will be denoted by the suffix H.
3. Text in data representation
Text code is a standard format for representing letters, punctuation marks, and other symbols. The four most common text code systems:
EBCDIC : EBCDIC is an IBM-developed data-encoding scheme that uses a specific eight-bit binary code for each number, alphabetic character, punctuation marks, accented letters, and non-alphabetic characters. EBCDIC differs from ASCII, the most commonly used text encoding scheme, in that it divides each character’s eight bits into two four-bit zones.
ASCII: ASCII stands for American Standard Code for Information Interchange, and it is a standard for allocating letters, numbers, and other characters to the 256 slots available in an 8-bit code. Binary, which is the language of all computers, is used to construct the ASCII decimal (Dec) number. The lowercase “h” character (Char) has a decimal value of 104, which is “01101000” in binary, as seen in the table below. The X3 committee, which is part of the ASA, established and published ASCII for the first time in 1963.
Extended ASCII: To represent text in a computer system, we assign a unique number to each character. This number is referred to as its code. We can then use binary ones and zeros to store this code on the computer. Computers can understand ASCII code because it tells them how to represent text. Each character in ASCII is represented by a binary value (letter, number, symbol, or control character). Extended ASCII is a variant of ASCII that supports 256 different characters. Since extended ASCII uses eight bits to represent a character instead of seven in standard ASCII, this is the case. In extended ASCII, the maximum number of characters that can be expressed is 256.
Unicode: Many of these schemes used code pages with only 256 characters, each of which needed 8 bits of storage. Although this was relatively lightweight, it was insufficient to hold ideographic character sets with thousands of characters, such as Chinese and Japanese. It also prevented the coexistence of character sets from multiple languages. Unicode is an attempt to unify all of the various text-encoding systems into a single universal standard.
4. Images and Colours in data representation
Computer screens and similar devices often use three colours, but they need a different set of primary colours since they are additive, meaning they start with a black screen and add colour to it. The colours red, green, and blue (RGB) are used in additive colours on computers. On a computer screen, each pixel comprises three tiny “lights”: one red, one green, and one blue. All of the different colours can be created by varying the amount of light coming from each of these three. You will experiment with RGB in the following interactive.
5. Program Instructions in data representation
We can interpret an entire program using binary in the same way as representing text or numbers using it. Since a program is nothing more than a set of instructions, we must first determine how many bits to use to represent each instruction and interpret those bits. Operation and operand are two pieces of machine code that are usually combined in instructions. Entire computer programs can be analysed in the same binary format by using bits to represent both the program instructions and data forms such as text, numbers, and images. This makes it possible to store programs on discs in memory and transfer them over the internet just like files.
Computers are information-processing devices. You will use them to view, listen to, create, and edit data in documents, photographs, videos, sound, spreadsheets, and databases. They allow you to compute and measure numerical data, as well as send and receive data over networks. The computer must reflect the information in some way within the computer’s memory, as well as store it on disc or send it over a network, for all of this to function.
For counting and calculating, humans use the decimal (base 10) and duodecimal (base 12) number systems (probably because we have ten fingers and two big toes). Since computers are made up of binary digital components (known as transistors) that operate in two states – on and off – they use the binary (base 2) number system.
If you are interested in making a career in the Data Science domain, our 11-month in-person Postgraduate Certificate Diploma in Data Science course can help you immensely in becoming a successful Data Science professional.
- 7 Important Advanced Data Structures: Simplified
- 10+ Best Data Governance Tools (2021)
Fill in the details to know more
PEOPLE ALSO READ

Related Articles

From The Eyes Of Emerging Technologies: IPL Through The Ages
April 29, 2023
Data Visualization Best Practices
March 23, 2023
What Are Distribution Plots in Python?
March 20, 2023

What Are DDL Commands in SQL?
March 10, 2023

Best TCS Data Analyst Interview Questions and Answers for 2023
March 7, 2023

Best Data Science Companies for Data Scientists !
February 26, 2023
Are you ready to build your own career?
Query? Ask Us
Enter Your Details ×
Find Study Materials for
- Business Studies
- Combined Science
- Computer Science
- Engineering
- English Literature
- Environmental Science
- Human Geography
- Macroeconomics
- Microeconomics
- Social Studies
- Browse all subjects
- Read our Magazine
Create Study Materials
Dive deep into the realm of Computer Science with this comprehensive guide about data representation. Data representation, a fundamental concept in computing, refers to the various ways that information can be expressed digitally. The interpretation of this data plays a critical role in decision-making procedures in businesses and scientific research. Gain an understanding of binary data representation, the backbone of digital computing.

Explore our app and discover over 50 million learning materials for free.
Data Representation in Computer Science
Want to get better grades, get free, full access to:.
- Explanations
- Study Planner
- Textbook solutions
- StudySmarter AI
- Textbook Solutions
- Algorithms in Computer Science
- Computer Network
- Computer Organisation and Architecture
- Computer Programming
- Computer Systems
- Analogue Signal
- Binary Arithmetic
- Binary Conversion
- Binary Number System
- Bitmap Graphics
- Data Compression
- Data Encoding
- Digital Signal
- Hexadecimal Conversion
- Hexadecimal Number System
- Huffman Coding
- Image Representation
- Lempel Ziv Welch
- Logic Circuits
- Lossless Compression
- Lossy Compression
- Numeral Systems
- Quantisation
- Run Length Encoding
- Sample Rate
- Sampling Informatics
- Sampling Theorem
- Signal Processing
- Sound Representation
- Two's Complement
- What is ASCII
- What is Unicode
- What is Vector Graphics
- Data Structures
- Functional Programming
- Issues in Computer Science
- Problem Solving Techniques
- Theory of Computation
Lerne mit deinen Freunden und bleibe auf dem richtigen Kurs mit deinen persönlichen Lernstatistiken
Nie wieder prokastinieren mit unseren Lernerinnerungen.
Dive deep into the realm of Computer Science with this comprehensive guide about data representation. Data representation, a fundamental concept in computing, refers to the various ways that information can be expressed digitally. The interpretation of this data plays a critical role in decision-making procedures in businesses and scientific research. Gain an understanding of binary data representation, the backbone of digital computing.
Binary data representation uses a system of numerical notation that has just two possible states represented by 0 and 1 (also known as 'binary digits' or 'bits'). Grasp the practical applications of binary data representation and explore its benefits.
Finally, explore the vast world of data model representation. Different types of data models offer a variety of ways to organise data in databases . Understand the strategic role of data models in data representation, and explore how they are used to design efficient database systems. This comprehensive guide positions you at the heart of data representation in Computer Science.
Understanding Data Representation in Computer Science
In the realm of Computer Science, data representation plays a paramount role. It refers to the methods or techniques used to represent, or express information in a computer system. This encompasses everything from text and numbers to images, audio, and beyond.
Basic Concepts of Data Representation
Data representation in computer science is about how a computer interprets and functions with different types of information. Different information types require different representation techniques. For instance, a video will be represented differently than a text document.
When working with various forms of data, it is important to grasp a fundamental understanding of:
- Binary system
- Bits and Bytes
- Number systems: decimal, hexadecimal
- Character encoding: ASCII, Unicode
Data in a computer system is represented in binary format, as a sequence of 0s and 1s, denoting 'off' and 'on' states respectively. The smallest component of this binary representation is known as a bit , which stands for 'binary digit'.
A byte , on the other hand, generally encompasses 8 bits. An essential aspect of expressing numbers and text in a computer system, are the decimal and hexadecimal number systems, and character encodings like ASCII and Unicode.
Role of Data Representation in Computer Science
Data Representation is the foundation of computing systems and affects both hardware and software designs. It enables both logic and arithmetic operations to be performed in the binary number system , on which computers are based.
An illustrative example of the importance of data representation is when you write a text document. The characters you type are represented in ASCII code - a set of binary numbers. Each number is sent to the memory, represented as electrical signals; everything you see on your screen is a representation of the underlying binary data.
Computing operations and functions, like searching, sorting or adding, rely heavily on appropriate data representation for efficient execution. Also, computer programming languages and compilers require a deep understanding of data representation to successfully interpret and execute commands.
As technology evolves, so too does our data representation techniques. Quantum computing, for example, uses quantum bits or "qubits". A qubit can represent a 0, 1, or both at the same time, thanks to the phenomenon of quantum superposition.
Types of Data Representation
In computer systems , various types of data representation techniques are utilized:
Numbers can be represented in real, integer, and rational formats. Text is represented by using different types of encodings, such as ASCII or Unicode. Images can be represented in various formats like JPG, PNG, or GIF, each having its specific rendering algorithm and compression techniques.
Tables are another important way of data representation, especially in the realm of databases .
This approach is particularly effective in storing structured data, making information readily accessible and easy to handle. By understanding the principles of data representation, you can better appreciate the complexity and sophistication behind our everyday interactions with technology.
Data Representation and Interpretation
To delve deeper into the world of Computer Science, it is essential to study the intricacies of data representation and interpretation. While data representation is about the techniques through which data are expressed or encoded in a computer system, data interpretation refers to the computing machines' ability to understand and work with these encoded data.
Basics of Data Representation and Interpretation
The core of data representation and interpretation is founded on the binary system. Represented by 0s and 1s, the binary system signifies the 'off' and 'on' states of electric current, seamlessly translating them into a language comprehensible to computing hardware.
For instance, \[ 1101 \, \text{in binary is equivalent to} \, 13 \, \text{in decimal} \] This interpretation happens consistently in the background during all of your interactions with a computer system.
Now, try imagining a vast array of these binary numbers. It could get overwhelming swiftly. To bring order and efficiency to this chaos, binary digits (or bits) are grouped into larger sets like bytes, kilobytes, and so on. A single byte , the most commonly used set, contains eight bits. Here's a simplified representation of how bits are grouped:
- 1 bit = Binary Digit
- 8 bits = 1 byte
- 1024 bytes = 1 kilobyte (KB)
- 1024 KB = 1 megabyte (MB)
- 1024 MB = 1 gigabyte (GB)
- 1024 GB = 1 terabyte (TB)
However, the binary system isn't the only number system pivotal for data interpretation. Both decimal (base 10) and hexadecimal (base 16) systems play significant roles in processing numbers and text data. Moreover, translating human-readable language into computer interpretable format involves character encodings like ASCII (American Standard Code for Information Interchange) and Unicode.
These systems interpret alphabetic characters, numerals, punctuation marks, and other common symbols into binary code. For example, the ASCII value for capital 'A' is 65, which corresponds to \(01000001\) in binary.
In the world of images, different encoding schemes interpret pixel data. JPG, PNG, and GIF, being common examples of such encoded formats. Similarly, audio files utilise encoding formats like MP3 and WAV to store sound data.
Importance of Data Interpretation in Computer Science
Understanding data interpretation in computer science is integral to unlocking the potential of any computing process or system. When coded data is input into a system, your computer must interpret this data accurately to make it usable.
Consider typing a document in a word processor like Microsoft Word. As you type, each keystroke is converted to an ASCII code by your keyboard. Stored as binary, these codes are transmitted to the active word processing software. The word processor interprets these codes back into alphabetic characters, enabling the correct letters to appear on your screen, as per your keystrokes.
Data interpretation is not just an isolated occurrence, but a recurring necessity - needed every time a computing process must deal with data. This is no different when you're watching a video, browsing a website, or even when the computer boots up.
Rendering images and videos is an ideal illustration of the importance of data interpretation.
Digital photos and videos are composed of tiny dots, or pixels, each encoded with specific numbers to denote colour composition and intensity. Every time you view a photo or play a video, your computer interprets the underlying data and reassembles the pixels to form a comprehensible image or video sequence on your screen.
Data interpretation further extends to more complex territories like facial recognition, bioinformatics, data mining, and even artificial intelligence. In these applications, data from various sources is collected, converted into machine-acceptable format, processed, and interpreted to provide meaningful outputs.
In summary, data interpretation is vital for the functionality, efficiency, and progress of computer systems and the services they provide. Understanding the basics of data representation and interpretation, thereby, forms the backbone of computer science studies.
Delving into Binary Data Representation
Binary data representation is the most fundamental and elementary form of data representation in computing systems. At the lowermost level, every piece of information processed by a computer is converted into a binary format.
Understanding Binary Data Representation
Binary data representation is based on the binary numeral system. This system, also known as the base-2 system, uses only two digits - 0 and 1 to represent all kinds of data. The concept dates back to the early 18th-century mathematics and has since found its place as the bedrock of modern computers. In computing, the binary system's digits are called bits (short for 'binary digit'), and they are the smallest indivisible unit of data.
Each bit can be in one of two states representing 0 ('off') or 1 ('on'). Formally, the binary number \( b_n b_{n-1} ... b_2 b_1 b_0 \), is interpreted using the formula: \[ B = b_n \times 2^n + b_{n-1} \times 2^{n-1} + ... + b_2 \times 2^2 + b_1 \times 2^1 + b_0 \times 2^0 \] Where \( b_i \) are the binary digits and \( B \) is the corresponding decimal number.
For example, for the binary number 1011, the process will look like this: \[ B = 1*2^3 + 0*2^2 + 1*2^1 + 1*2^0 \]
This mathematical translation makes it possible for computing machines to perform complex operations even though they understand only the simple language of 'on' and 'off' signals.
When representing character data, computing systems use binary-encoded formats. ASCII and Unicode are common examples. In ASCII, each character is assigned a unique 7-bit binary code. For example, the binary representation for the uppercase letter 'A' is 0100001. Interpreting such encoded data back to a human-readable format is a core responsibility of computing systems and forms the basis for the exchange of digital information globally.
Practical Application of Binary Data Representation
Binary data representation is used across every single aspect of digital computing. From simple calculations performed by a digital calculator to the complex animations rendered in a high-definition video game, binary data representation is at play in the background.
Consider a simple calculation like 7+5. When you input this into a digital calculator, the numbers and the operation get converted into their binary equivalents. The microcontroller inside the calculator processes these binary inputs, performs the sum operation in binary, and finally, returns the result as a binary output. This binary output is then converted back into a decimal number which you see displayed on the calculator screen.
When it comes to text files, every character typed into the document is converted to its binary equivalent using a character encoding system, typically ASCII or Unicode. It is then saved onto your storage device as a sequence of binary digits.
Similarly, for image files, every pixel is represented as a binary number. Each binary number, called a 'bit map', specifies the colour and intensity of each pixel. When you open the image file, the computer reads the binary data and presents it on your screen as a colourful, coherent image. The concept extends even further into the internet and network communications, data encryption , data compression , and more.
When you are downloading a file over the internet, it is sent to your system as a stream of binary data. The web browser on your system receives this data, recognizes the type of file and accordingly interprets the binary data back into the intended format.
In essence, every operation that you can perform on a computer system, no matter how simple or complex, essentially boils down to large-scale manipulation of binary data. And that sums up the practical application and universal significance of binary data representation in digital computing.
Binary Tree Representation in Data Structures
Binary trees occupy a central position in data structures , especially in algorithms and database designs. As a non-linear data structure, a binary tree is essentially a tree-like model where each node has a maximum of two children, often distinguished as 'left child' and 'right child'.
Fundamentals of Binary Tree Representation
A binary tree is a tree data structure where each parent node has no more than two children, typically referred to as the left child and the right child. Each node in the binary tree contains:
- A data element
- Pointer or link to the left child
- Pointer or link to the right child
The topmost node of the tree is known as the root. The nodes without any children, usually dwelling at the tree's last level, are known as leaf nodes or external nodes. Binary trees are fundamentally differentiated by their properties and the relationships among the elements. Some types include:
- Full Binary Tree: A binary tree where every node has 0 or 2 children.
- Complete Binary Tree: A binary tree where all levels are completely filled except possibly the last level, which is filled from left to right.
- Perfect Binary Tree: A binary tree where all internal nodes have two children and all leaves are at the same level.
- Skewed Binary Tree: A binary tree where every node has only left child or only right child.
In a binary tree, the maximum number of nodes \( N \) at any level \( L \) can be calculated using the formula \( N = 2^{L-1} \). Conversely, for a tree with \( N \) nodes, the maximum height or maximum number of levels is \( \lceil Log_2(N+1) \rceil \).
Binary tree representation employs arrays and linked lists. Sometimes, an implicit array-based representation suffices, especially for complete binary trees. The root is stored at index 0, while for each node at index \( i \), the left child is stored at index \( 2i + 1 \), and the right child at \( 2i + 2 \).
However, the most common representation is the linked-node representation that utilises a node-based structure. Each node in the binary tree is a data structure that contains a data field and two pointers pointing to its left and right child nodes.
Usage of Binary Tree in Data Structures
Binary trees are typically used for expressing hierarchical relationships, and thus find application across various areas in computer science. In mathematical applications, binary trees are ideal for expressing certain elements' relationships.
For example, binary trees are used to represent expressions in arithmetic and Boolean algebra.
Consider an arithmetic expression like (4 + 5) * 6. This can be represented using a binary tree where the operators are parent nodes, and the operands are children. The expression gets evaluated by performing operations in a specific tree traversal order.
Among the more complex usages, binary search trees — a variant of binary trees — are employed in database engines and file systems .
- Binary Heaps, a type of binary tree, are used as an efficient priority queue in many algorithms like Dijkstra's algorithm and the Heap Sort algorithm.
- Binary trees are also used in creating binary space partition trees, which are used for quickly finding objects in games and 3D computer graphics.
- Syntax trees used in compilers are a direct application of binary trees. They help translate high-level language expressions into machine code.
- Huffman Coding Trees, which are used in data compression algorithms, are another variant of binary trees.
The theoretical underpinnings of all these binary tree applications are the traversal methods and operations, such as insertion and deletion, which are intrinsic to the data structure.
Binary trees are also used in advanced machine-learning algorithms. Decision Tree is a type of binary tree that uses a tree-like model of decisions. It is one of the most successful forms of supervised learning algorithms in data mining and machine learning.
The advantages of a binary tree lie in their efficient organisation and quick data access, making them a cornerstone of many complex data structures and algorithms. Understanding the workings and fundamentals of binary tree representation will equip you with a stronger pillaring in the world of data structures and computer science in general.
Grasping Data Model Representation
When dealing with vast amounts of data, organising and understanding the relationships between different pieces of data is of utmost importance. This is where data model representation comes into play in computer science. A data model provides an abstract, simplified view of real-world data. It defines the data elements and the relationships among them, providing an organised and consistent representation of data.
Exploring Different Types of Data Models
Understanding the intricacies of data models will equip you with a solid foundation in making sense of complex data relationships. Some of the most commonly used data models include:
- Hierarchical Model
- Network Model
- Relational Model
- Entity-Relationship Model
- Object-Oriented Model
- Semantic Model
The Hierarchical Model presents data in a tree-like structure, where each record has one parent record and many children. This model is largely applied in file systems and XML documents. The limitations are that this model does not allow a child to have multiple parents, thus limiting its real-world applications.
The Network Model, an enhancement of the hierarchical model, allows a child node to have multiple parent nodes, resulting in a graph structure. This model is suitable for representing complex relationships but comes with its own challenges such as iteration and navigation, which can be intricate.
The Relational Model, created by E.F. Codd, uses a tabular structure to depict data and their relationships. Each row represents a collection of related data values, and each column represents a particular attribute. This is the most widely used model due to its simplicity and flexibility.
The Entity-Relationship Model illustrates the conceptual view of a database. It uses three basic concepts: Entities, Attributes (the properties of these entities), and Relationships among entities. This model is most commonly used in database design .
The Object-Oriented Model goes a step further and adds methods (functions) to the entities besides attributes. This data model integrates the data and the operations applicable to the data into a single component known as an object. Such an approach enables encapsulation, a significant characteristic of object-oriented programming.
The Semantic Model aims to capture more meaning of data by defining the nature of data and the relationships that exist between them. This model is beneficial in representing complex data interrelations and is used in expert systems and artificial intelligence fields.
The Role of Data Models in Data Representation
Data models provide a method for the efficient representation and interaction of data elements, thus forming an integral part of any database system. They provide the theoretical foundation for designing databases, thereby playing an essential role in the development of applications.
A data model is a set of concepts and rules for formally describing and representing real-world data. It serves as a blueprint for designing and implementing databases and assists communication between system developers and end-users.
Databases serve as vast repositories, storing a plethora of data. Such vast data needs effective organisation and management for optimal access and usage. Here, data models come into play, providing a structural view of data, thereby enabling the efficient organisation, storage and retrieval of data.
Consider a library system. The system needs to record data about books, authors, publishers, members, and loans. All these items represent different entities. Relationships exist between these entities. For example, a book is published by a publisher, an author writes a book, or a member borrows a book. Using an Entity-Relationship Model, we can effectively represent all these entities and relationships, aiding the library system's development process.
Designing such a model requires careful consideration of what data is required to be stored and how different data elements relate to each other. Depending on their specific requirements, database developers can select the most suitable data model representation. This choice can significantly affect the functionality, performance, and scalability of the resulting databases.
From decision-support systems and expert systems to distributed databases and data warehouses, data models find a place in various applications.
Modern NoSQL databases often use several models simultaneously to meet their needs. For example, a document-based model for unstructured data and a column-based model for analyzing large data sets. In this way, data models continue to evolve and adapt to the burgeoning needs of the digital world.
Therefore, acquiring a strong understanding of data model representations and their roles forms an integral part of the database management and design process. It empowers you with the ability to handle large volumes of diverse data efficiently and effectively.
Data Representation - Key takeaways
- Data representation refers to techniques used to express information in computer systems, encompassing text, numbers, images, audio, and more.
- Data Representation is about how computers interpret and function with different information types, including binary systems, bits and bytes, number systems (decimal, hexadecimal) and character encoding (ASCII, Unicode).
- Binary Data Representation is the conversion of all kinds of information processed by a computer into binary format.
- Express hierarchical relationships across various areas in computer science.
- Represent relationships in mathematical applications, used in database engines, file systems, and priority queues in algorithms.
- Data Model Representation is an abstract, simplified view of real-world data that defines the data elements, and their relationships and provides a consistently organised way of representing data.
Frequently Asked Questions about Data Representation in Computer Science
--> what is data representation.
Data representation is the method used to encode information into a format that can be used and understood by computer systems. It involves the conversion of real-world data, such as text, images, sounds, numbers, into forms like binary or hexadecimal which computers can process. The choice of representation can affect the quality, accuracy and efficiency of data processing. Precisely, it's how computer systems interpret and manipulate data.
--> What does data representation mean?
Data representation refers to the methods or techniques used to express, display or encode data in a readable format for a computer or a user. This could be in different forms such as binary, decimal, or alphabetic forms. It's crucial in computer science since it links the abstract world of thought and concept to the concrete domain of signals, signs and symbols. It forms the basis of information processing and storage in contemporary digital computing systems.
--> Why is data representation important?
Data representation is crucial as it allows information to be processed, transferred, and interpreted in a meaningful way. It helps in organising and analysing data effectively, providing insights for decision-making processes. Moreover, it facilitates communication between the computer system and the real world, enabling computing outcomes to be understood by users. Finally, accurate data representation ensures integrity and reliability of the data, which is vital for effective problem solving.
--> How to make a graphical representation of data?
To create a graphical representation of data, first collect and organise your data. Choose a suitable form of data representation such as bar graphs, pie charts, line graphs, or histograms depending on the type of data and the information you want to display. Use a data visualisation tool or software such as Excel or Tableau to help you generate the graph. Always remember to label your axes and provide a title and legend if necessary.
--> What is data representation in statistics?
Data representation in statistics refers to the various methods used to display or present data in meaningful ways. This often includes the use of graphs, charts, tables, histograms or other visual tools that can help in the interpretation and analysis of data. It enables efficient communication of information and helps in drawing statistical conclusions. Essentially, it's a way of providing a visual context to complex datasets, making the data easily understandable.
Test your knowledge with multiple choice flashcards
What is data representation in computer science?
What are some of the fundamental concepts to understand when dealing with data representation?
Why is data representation crucial in computer science?
Your score:

Join the StudySmarter App and learn efficiently with millions of flashcards and more!
Learn with 441 data representation in computer science flashcards in the free studysmarter app.
Already have an account? Log in
Data representation in computer science refers to the methods used to express information in a computer system. It's how a computer interprets and functions with different information types, ranging from text and numbers to images, audio, and beyond.
When dealing with data representation, one should understand the binary system, bits and bytes, number systems like decimal and hexadecimal, and character encoding such as ASCII and Unicode.
Data representation forms the foundation of computer systems and affects hardware and software designs. It enables logic and arithmetic operations to be performed in the binary number system, and is integral to computer programming languages and compilers.
What is the relationship between data representation and the binary system in computer systems?
The core of data representation in computer systems is based on the binary system, which uses 0s and 1s, representing 'off' and 'on' states of electric current. These translate into a language that computer hardware can understand.
What are the larger sets into which binary digits or bits are grouped for efficiency and order?
Binary digits or bits are grouped into larger sets like bytes, kilobytes, MB, GB and TB. For instance, 8 bits make up a byte, and 1024 bytes make up a kilobyte.
How does data interpretation contribute to the functionality of computer systems and services?
Data interpretation is vital as it allows coded data to be accurately translated into a usable format for any computer process or system. It is a recurring necessity whenever a computing process has to deal with data.
of the users don't pass the Data Representation in Computer Science quiz! Will you pass the quiz?
How would you like to learn this content?
Free computer-science cheat sheet!
Everything you need to know on . A perfect summary so you can easily remember everything.
Join over 22 million students in learning with our StudySmarter App
The first learning app that truly has everything you need to ace your exams in one place
- Flashcards & Quizzes
- AI Study Assistant
- Smart Note-Taking

Sign up to highlight and take notes. It’s 100% free.
This is still free to read, it's not a paywall.
You need to register to keep reading, create a free account to save this explanation..
Save explanations to your personalised space and access them anytime, anywhere!
By signing up, you agree to the Terms and Conditions and the Privacy Policy of StudySmarter.
Entdecke Lernmaterial in der StudySmarter-App
If you're seeing this message, it means we're having trouble loading external resources on our website.
If you're behind a web filter, please make sure that the domains *.kastatic.org and *.kasandbox.org are unblocked.
To log in and use all the features of Khan Academy, please enable JavaScript in your browser.
Praxis Core Math
Course: praxis core math > unit 1.
- Data representations | Lesson
Data representations | Worked example
- Center and spread | Lesson
- Center and spread | Worked example
- Random sampling | Lesson
- Random sampling | Worked example
- Scatterplots | Lesson
- Scatterplots | Worked example
- Interpreting linear models | Lesson
- Interpreting linear models | Worked example
- Correlation and Causation | Lesson
- Correlation and causation | Worked example
- Probability | Lesson
- Probability | Worked example
Want to join the conversation?
- Upvote Button navigates to signup page
- Downvote Button navigates to signup page
- Flag Button navigates to signup page
Video transcript
Talk to our experts
1800-120-456-456
- Introduction to Data Representation
- Computer Science

About Data Representation
Data can be anything, including a number, a name, musical notes, or the colour of an image. The way that we stored, processed, and transmitted data is referred to as data representation. We can use any device, including computers, smartphones, and iPads, to store data in digital format. The stored data is handled by electronic circuitry. A bit is a 0 or 1 used in digital data representation.

Data Representation Techniques
Classification of Computers
Computer scans are classified broadly based on their speed and computing power.
1. Microcomputers or PCs (Personal Computers): It is a single-user computer system with a medium-power microprocessor. It is referred to as a computer with a microprocessor as its central processing unit.

Microcomputer
2. Mini-Computer: It is a multi-user computer system that can support hundreds of users at the same time.

Types of Mini Computers
3. Mainframe Computer: It is a multi-user computer system that can support hundreds of users at the same time. Software technology is distinct from minicomputer technology.

Mainframe Computer
4. Super-Computer: With the ability to process hundreds of millions of instructions per second, it is a very quick computer. They are used for specialised applications requiring enormous amounts of mathematical computations, but they are very expensive.

Supercomputer
Types of Computer Number System
Every value saved to or obtained from computer memory uses a specific number system, which is the method used to represent numbers in the computer system architecture. One needs to be familiar with number systems in order to read computer language or interact with the system.

Types of Number System
1. Binary Number System
There are only two digits in a binary number system: 0 and 1. In this number system, 0 and 1 stand in for every number (value). Because the binary number system only has two digits, its base is 2.
A bit is another name for each binary digit. The binary number system is also a positional value system, where each digit's value is expressed in powers of 2.
Characteristics of Binary Number System
The following are the primary characteristics of the binary system:
It only has two digits, zero and one.
Depending on its position, each digit has a different value.
Each position has the same value as a base power of two.
Because computers work with internal voltage drops, it is used in all types of computers.

Binary Number System
2. Decimal Number System
The decimal number system is a base ten number system with ten digits ranging from 0 to 9. This means that these ten digits can represent any numerical quantity. A positional value system is also a decimal number system. This means that the value of digits will be determined by their position.
Characteristics of Decimal Number System
Ten units of a given order equal one unit of the higher order, making it a decimal system.
The number 10 serves as the foundation for the decimal number system.
The value of each digit or number will depend on where it is located within the numeric figure because it is a positional system.
The value of this number results from multiplying all the digits by each power.

Decimal Number System
Decimal Binary Conversion Table
3. octal number system.
There are only eight (8) digits in the octal number system, from 0 to 7. In this number system, each number (value) is represented by the digits 0, 1, 2, 3,4,5,6, and 7. Since the octal number system only has 8 digits, its base is 8.
Characteristics of Octal Number System:
Contains eight digits: 0,1,2,3,4,5,6,7.
Also known as the base 8 number system.
Each octal number position represents a 0 power of the base (8).
An octal number's last position corresponds to an x power of the base (8).

Octal Number System
4. Hexadecimal Number System
There are sixteen (16) alphanumeric values in the hexadecimal number system, ranging from 0 to 9 and A to F. In this number system, each number (value) is represented by 0, 1, 2, 3, 5, 6, 7, 8, 9, A, B, C, D, E, and F. Because the hexadecimal number system has 16 alphanumeric values, its base is 16. Here, the numbers are A = 10, B = 11, C = 12, D = 13, E = 14, and F = 15.
Characteristics of Hexadecimal Number System:
A system of positional numbers.
Has 16 symbols or digits overall (0, 1, 2, 3, 4, 5, 6, 7, 8, 9, A, B, C, D, E, F). Its base is, therefore, 16.
Decimal values 10, 11, 12, 13, 14, and 15 are represented by the letters A, B, C, D, E, and F, respectively.
A single digit may have a maximum value of 15.
Each digit position corresponds to a different base power (16).
Since there are only 16 digits, any hexadecimal number can be represented in binary with 4 bits.

Hexadecimal Number System
So, we've seen how to convert decimals and use the Number System to communicate with a computer. The full character set of the English language, which includes all alphabets, punctuation marks, mathematical operators, special symbols, etc., must be supported by the computer in addition to numerical data.
Learning By Doing
Choose the correct answer:.
1. Which computer is the largest in terms of size?
Minicomputer
Micro Computer
2. The binary number 11011001 is converted to what decimal value?
Solved Questions
1. Give some examples where Supercomputers are used.
Ans: Weather Prediction, Scientific simulations, graphics, fluid dynamic calculations, Nuclear energy research, electronic engineering and analysis of geological data.
2. Which of these is the most costly?
Mainframe computer
Ans: C) Supercomputer
FAQs on Introduction to Data Representation
1. What is the distinction between the Hexadecimal and Octal Number System?
The octal number system is a base-8 number system in which the digits 0 through 7 are used to represent numbers. The hexadecimal number system is a base-16 number system that employs the digits 0 through 9 as well as the letters A through F to represent numbers.
2. What is the smallest data representation?
The smallest data storage unit in a computer's memory is called a BYTE, which comprises 8 BITS.
3. What is the largest data unit?
The largest commonly available data storage unit is a terabyte or TB. A terabyte equals 1,000 gigabytes, while a tebibyte equals 1,024 gibibytes.

Data Representation in Computer: Number Systems, Characters, Audio, Image and Video
- Post author: Anuj Kumar
- Post published: 16 July 2021
- Post category: Computer Science
- Post comments: 0 Comments
Table of Contents
- 1 What is Data Representation in Computer?
- 2.1 Binary Number System
- 2.2 Octal Number System
- 2.3 Decimal Number System
- 2.4 Hexadecimal Number System
- 3.4 Unicode
- 4 Data Representation of Audio, Image and Video
- 5.1 What is number system with example?
What is Data Representation in Computer?
A computer uses a fixed number of bits to represent a piece of data which could be a number, a character, image, sound, video, etc. Data representation is the method used internally to represent data in a computer. Let us see how various types of data can be represented in computer memory.
Before discussing data representation of numbers, let us see what a number system is.
Number Systems
Number systems are the technique to represent numbers in the computer system architecture, every value that you are saving or getting into/from computer memory has a defined number system.
A number is a mathematical object used to count, label, and measure. A number system is a systematic way to represent numbers. The number system we use in our day-to-day life is the decimal number system that uses 10 symbols or digits.
The number 289 is pronounced as two hundred and eighty-nine and it consists of the symbols 2, 8, and 9. Similarly, there are other number systems. Each has its own symbols and method for constructing a number.
A number system has a unique base, which depends upon the number of symbols. The number of symbols used in a number system is called the base or radix of a number system.
Let us discuss some of the number systems. Computer architecture supports the following number of systems:
Binary Number System
Octal number system, decimal number system, hexadecimal number system.

A Binary number system has only two digits that are 0 and 1. Every number (value) represents 0 and 1 in this number system. The base of the binary number system is 2 because it has only two digits.
The octal number system has only eight (8) digits from 0 to 7. Every number (value) represents with 0,1,2,3,4,5,6 and 7 in this number system. The base of the octal number system is 8, because it has only 8 digits.
The decimal number system has only ten (10) digits from 0 to 9. Every number (value) represents with 0,1,2,3,4,5,6, 7,8 and 9 in this number system. The base of decimal number system is 10, because it has only 10 digits.
A Hexadecimal number system has sixteen (16) alphanumeric values from 0 to 9 and A to F. Every number (value) represents with 0,1,2,3,4,5,6, 7,8,9,A,B,C,D,E and F in this number system. The base of the hexadecimal number system is 16, because it has 16 alphanumeric values.
Here A is 10, B is 11, C is 12, D is 13, E is 14 and F is 15 .
Data Representation of Characters
There are different methods to represent characters . Some of them are discussed below:

The code called ASCII (pronounced ‘’.S-key”), which stands for American Standard Code for Information Interchange, uses 7 bits to represent each character in computer memory. The ASCII representation has been adopted as a standard by the U.S. government and is widely accepted.
A unique integer number is assigned to each character. This number called ASCII code of that character is converted into binary for storing in memory. For example, the ASCII code of A is 65, its binary equivalent in 7-bit is 1000001.
Since there are exactly 128 unique combinations of 7 bits, this 7-bit code can represent only128 characters. Another version is ASCII-8, also called extended ASCII, which uses 8 bits for each character, can represent 256 different characters.
For example, the letter A is represented by 01000001, B by 01000010 and so on. ASCII code is enough to represent all of the standard keyboard characters.
It stands for Extended Binary Coded Decimal Interchange Code. This is similar to ASCII and is an 8-bit code used in computers manufactured by International Business Machines (IBM). It is capable of encoding 256 characters.
If ASCII-coded data is to be used in a computer that uses EBCDIC representation, it is necessary to transform ASCII code to EBCDIC code. Similarly, if EBCDIC coded data is to be used in an ASCII computer, EBCDIC code has to be transformed to ASCII.
ISCII stands for Indian Standard Code for Information Interchange or Indian Script Code for Information Interchange. It is an encoding scheme for representing various writing systems of India. ISCII uses 8-bits for data representation.
It was evolved by a standardization committee under the Department of Electronics during 1986-88 and adopted by the Bureau of Indian Standards (BIS). Nowadays ISCII has been replaced by Unicode.
Using 8-bit ASCII we can represent only 256 characters. This cannot represent all characters of written languages of the world and other symbols. Unicode is developed to resolve this problem. It aims to provide a standard character encoding scheme, which is universal and efficient.
It provides a unique number for every character, no matter what the language and platform be. Unicode originally used 16 bits which can represent up to 65,536 characters. It is maintained by a non-profit organization called the Unicode Consortium.
The Consortium first published version 1.0.0 in 1991 and continues to develop standards based on that original work. Nowadays Unicode uses more than 16 bits and hence it can represent more characters. Unicode can represent characters in almost all written languages of the world.
Data Representation of Audio, Image and Video
In most cases, we may have to represent and process data other than numbers and characters. This may include audio data, images, and videos. We can see that like numbers and characters, the audio, image, and video data also carry information.
We will see different file formats for storing sound, image, and video .
Multimedia data such as audio, image, and video are stored in different types of files. The variety of file formats is due to the fact that there are quite a few approaches to compressing the data and a number of different ways of packaging the data.
For example, an image is most popularly stored in Joint Picture Experts Group (JPEG ) file format. An image file consists of two parts – header information and image data. Information such as the name of the file, size, modified data, file format, etc. is stored in the header part.
The intensity value of all pixels is stored in the data part of the file. The data can be stored uncompressed or compressed to reduce the file size. Normally, the image data is stored in compressed form. Let us understand what compression is.
Take a simple example of a pure black image of size 400X400 pixels. We can repeat the information black, black, …, black in all 16,0000 (400X400) pixels. This is the uncompressed form, while in the compressed form black is stored only once and information to repeat it 1,60,000 times is also stored.
Numerous such techniques are used to achieve compression. Depending on the application, images are stored in various file formats such as bitmap file format (BMP), Tagged Image File Format (TIFF), Graphics Interchange Format (GIF), Portable (Public) Network Graphic (PNG).
What we said about the header file information and compression is also applicable for audio and video files. Digital audio data can be stored in different file formats like WAV, MP3, MIDI, AIFF, etc. An audio file describes a format, sometimes referred to as the ‘container format’, for storing digital audio data.
For example, WAV file format typically contains uncompressed sound and MP3 files typically contain compressed audio data. The synthesized music data is stored in MIDI(Musical Instrument Digital Interface) files.
Similarly, video is also stored in different files such as AVI (Audio Video Interleave) – a file format designed to store both audio and video data in a standard package that allows synchronous audio with video playback, MP3, JPEG-2, WMV, etc.
FAQs About Data Representation in Computer
What is number system with example.
Let us discuss some of the number systems. Computer architecture supports the following number of systems: 1. Binary Number System 2. Octal Number System 3. Decimal Number System 4. Hexadecimal Number System
Related posts:
10 Types of Computers | History of Computers, Advantages
What is microprocessor evolution of microprocessor, types, features, what is operating system functions, types, types of user interface, what is cloud computing classification, characteristics, principles, types of cloud providers, what is debugging types of errors, what are functions of operating system 6 functions.
- What is Flowchart in Programming? Symbols, Advantages, Preparation
Advantages and Disadvantages of Flowcharts
What is c++ programming language c++ character set, c++ tokens.
- What are C++ Keywords? Set of 59 keywords in C ++
What are Data Types in C++? Types
What are operators in c different types of operators in c, what are expressions in c types, what are decision making statements in c types, types of storage devices, advantages, examples, you might also like.

10 Evolution of Computing Machine, History

Generations of Computer First To Fifth, Classification, Characteristics, Features, Examples

Data and Information: Definition, Characteristics, Types, Channels, Approaches

Types of Computer Software: Systems Software, Application Software

What is Computer System? Definition, Characteristics, Functional Units, Components

What is Artificial Intelligence? Functions, 6 Benefits, Applications of AI

Advantages and Disadvantages of Operating System
- Entrepreneurship
- Organizational Behavior
- Financial Management
- Communication
- Human Resource Management
- Sales Management
- Marketing Management
Page Statistics
Table of contents.
- Introduction to Functional Computer
- Fundamentals of Architectural Design
Data Representation
- Instruction Set Architecture : Instructions and Formats
- Instruction Set Architecture : Design Models
- Instruction Set Architecture : Addressing Modes
- Performance Measurements and Issues
- Computer Architecture Assessment 1
- Fixed Point Arithmetic : Addition and Subtraction
- Fixed Point Arithmetic : Multiplication
- Fixed Point Arithmetic : Division
- Floating Point Arithmetic
- Arithmetic Logic Unit Design
- CPU's Data Path
- CPU's Control Unit
- Control Unit Design
- Concepts of Pipelining
- Computer Architecture Assessment 2
- Pipeline Hazards
- Memory Characteristics and Organization
- Cache Memory
- Virtual Memory
- I/O Communication and I/O Controller
- Input/Output Data Transfer
- Direct Memory Access controller and I/O Processor
- CPU Interrupts and Interrupt Handling
- Computer Architecture Assessment 3
Course Computer Architecture
Digital computers store and process information in binary form as digital logic has only two values "1" and "0" or in other words "True or False" or also said as "ON or OFF". This system is called radix 2. We human generally deal with radix 10 i.e. decimal. As a matter of convenience there are many other representations like Octal (Radix 8), Hexadecimal (Radix 16), Binary coded decimal (BCD), Decimal etc.
Every computer's CPU has a width measured in terms of bits such as 8 bit CPU, 16 bit CPU, 32 bit CPU etc. Similarly, each memory location can store a fixed number of bits and is called memory width. Given the size of the CPU and Memory, it is for the programmer to handle his data representation. Most of the readers may be knowing that 4 bits form a Nibble, 8 bits form a byte. The word length is defined by the Instruction Set Architecture of the CPU. The word length may be equal to the width of the CPU.
The memory simply stores information as a binary pattern of 1's and 0's. It is to be interpreted as what the content of a memory location means. If the CPU is in the Fetch cycle, it interprets the fetched memory content to be instruction and decodes based on Instruction format. In the Execute cycle, the information from memory is considered as data. As a common man using a computer, we think computers handle English or other alphabets, special characters or numbers. A programmer considers memory content to be data types of the programming language he uses. Now recall figure 1.2 and 1.3 of chapter 1 to reinforce your thought that conversion happens from computer user interface to internal representation and storage.
- Data Representation in Computers
Information handled by a computer is classified as instruction and data. A broad overview of the internal representation of the information is illustrated in figure 3.1. No matter whether it is data in a numeric or non-numeric form or integer, everything is internally represented in Binary. It is up to the programmer to handle the interpretation of the binary pattern and this interpretation is called Data Representation . These data representation schemes are all standardized by international organizations.
Choice of Data representation to be used in a computer is decided by
- The number types to be represented (integer, real, signed, unsigned, etc.)
- Range of values likely to be represented (maximum and minimum to be represented)
- The Precision of the numbers i.e. maximum accuracy of representation (floating point single precision, double precision etc)
- If non-numeric i.e. character, character representation standard to be chosen. ASCII, EBCDIC, UTF are examples of character representation standards.
- The hardware support in terms of word width, instruction.
Before we go into the details, let us take an example of interpretation. Say a byte in Memory has value "0011 0001". Although there exists a possibility of so many interpretations as in figure 3.2, the program has only one interpretation as decided by the programmer and declared in the program.
- Fixed point Number Representation
Fixed point numbers are also known as whole numbers or Integers. The number of bits used in representing the integer also implies the maximum number that can be represented in the system hardware. However for the efficiency of storage and operations, one may choose to represent the integer with one Byte, two Bytes, Four bytes or more. This space allocation is translated from the definition used by the programmer while defining a variable as integer short or long and the Instruction Set Architecture.
In addition to the bit length definition for integers, we also have a choice to represent them as below:
- Unsigned Integer : A positive number including zero can be represented in this format. All the allotted bits are utilised in defining the number. So if one is using 8 bits to represent the unsigned integer, the range of values that can be represented is 28 i.e. "0" to "255". If 16 bits are used for representing then the range is 216 i.e. "0 to 65535".
- Signed Integer : In this format negative numbers, zero, and positive numbers can be represented. A sign bit indicates the magnitude direction as positive or negative. There are three possible representations for signed integer and these are Sign Magnitude format, 1's Compliment format and 2's Complement format .
Signed Integer – Sign Magnitude format: Most Significant Bit (MSB) is reserved for indicating the direction of the magnitude (value). A "0" on MSB means a positive number and a "1" on MSB means a negative number. If n bits are used for representation, n-1 bits indicate the absolute value of the number. Examples for n=8:
Examples for n=8:
0010 1111 = + 47 Decimal (Positive number)
1010 1111 = - 47 Decimal (Negative Number)
0111 1110 = +126 (Positive number)
1111 1110 = -126 (Negative Number)
0000 0000 = + 0 (Postive Number)
1000 0000 = - 0 (Negative Number)
Although this method is easy to understand, Sign Magnitude representation has several shortcomings like
- Zero can be represented in two ways causing redundancy and confusion.
- The total range for magnitude representation is limited to 2n-1, although n bits were accounted.
- The separate sign bit makes the addition and subtraction more complicated. Also, comparing two numbers is not straightforward.
Signed Integer – 1’s Complement format: In this format too, MSB is reserved as the sign bit. But the difference is in representing the Magnitude part of the value for negative numbers (magnitude) is inversed and hence called 1’s Complement form. The positive numbers are represented as it is in binary. Let us see some examples to better our understanding.
1101 0000 = - 47 Decimal (Negative Number)
1000 0001 = -126 (Negative Number)
1111 1111 = - 0 (Negative Number)
- Converting a given binary number to its 2's complement form
Step 1 . -x = x' + 1 where x' is the one's complement of x.
Step 2 Extend the data width of the number, fill up with sign extension i.e. MSB bit is used to fill the bits.
Example: -47 decimal over 8bit representation
As you can see zero is not getting represented with redundancy. There is only one way of representing zero. The other problem of the complexity of the arithmetic operation is also eliminated in 2’s complement representation. Subtraction is done as Addition.
More exercises on number conversion are left to the self-interest of readers.
- Floating Point Number system
The maximum number at best represented as a whole number is 2 n . In the Scientific world, we do come across numbers like Mass of an Electron is 9.10939 x 10⁻³¹ Kg. Velocity of light is 2.99792458 x 10⁸ m/s. Imagine to write the number in a piece of paper without exponent and converting into binary for computer representation. Sure you are tired!!. It makes no sense to write a number in non- readable form or non- processible form. Hence we write such large or small numbers using exponent and mantissa. This is said to be Floating Point representation or real number representation. he real number system could have infinite values between 0 and 1.
Representation in computer
Unlike the two's complement representation for integer numbers, Floating Point number uses Sign and Magnitude representation for both mantissa and exponent . In the number 9.10939 x 1031, in decimal form, +31 is Exponent, 9.10939 is known as Fraction . Mantissa, Significand and fraction are synonymously used terms. In the computer, the representation is binary and the binary point is not fixed. For example, a number, say, 23.345 can be written as 2.3345 x 101 or 0.23345 x 10² or 2334.5 x 10-2. The representation 2.3345 x 101 is said to be in normalised form.
Floating-point numbers usually use multiple words in memory as we need to allot a sign bit, few bits for exponent and many bits for mantissa. There are standards for such allocation which we will see sooner.
- IEEE 754 Floating Point Representation
We have two standards known as Single Precision and Double Precision from IEEE. These standards enable portability among different computers. Figure 3.3 picturizes Single precision while figure 3.4 picturizes double precision. Single Precision uses 32bit format while double precision is 64 bits word length. As the name suggests double precision can represent fractions with larger accuracy. In both the cases, MSB is sign bit for the mantissa part, followed by Exponent and Mantissa. The exponent part has its sign bit.
It is to be noted that in Single Precision, we can represent an exponent in the range -127 to +127. It is possible as a result of arithmetic operations the resulting exponent may not fit in. This situation is called overflow in the case of positive exponent and underflow in the case of negative exponent. The Double Precision format has 11 bits for exponent meaning a number as large as -1023 to 1023 can be represented. The programmer has to make a choice between Single Precision and Double Precision declaration using his knowledge about the data being handled.
The Floating Point operations on the regular CPU is very very slow. Generally, a special purpose CPU known as Co-processor is used. This Co-processor works in tandem with the main CPU. The programmer should be using the float declaration only if his data is in real number form. Float declaration is not to be used generously.
- Decimal Numbers Representation
Decimal numbers (radix 10) are represented and processed in the system with the support of additional hardware. We deal with numbers in decimal format in everyday life. Some machines implement decimal arithmetic too, like floating-point arithmetic hardware. In such a case, the CPU uses decimal numbers in BCD (binary coded decimal) form and does BCD arithmetic operation. BCD operates on radix 10. This hardware operates without conversion to pure binary. It uses a nibble to represent a number in packed BCD form. BCD operations require not only special hardware but also decimal instruction set.
- Exceptions and Error Detection
All of us know that when we do arithmetic operations, we get answers which have more digits than the operands (Ex: 8 x 2= 16). This happens in computer arithmetic operations too. When the result size exceeds the allotted size of the variable or the register, it becomes an error and exception. The exception conditions associated with numbers and number operations are Overflow, Underflow, Truncation, Rounding and Multiple Precision . These are detected by the associated hardware in arithmetic Unit. These exceptions apply to both Fixed Point and Floating Point operations. Each of these exceptional conditions has a flag bit assigned in the Processor Status Word (PSW). We may discuss more in detail in the later chapters.
- Character Representation
Another data type is non-numeric and is largely character sets. We use a human-understandable character set to communicate with computer i.e. for both input and output. Standard character sets like EBCDIC and ASCII are chosen to represent alphabets, numbers and special characters. Nowadays Unicode standard is also in use for non-English language like Chinese, Hindi, Spanish, etc. These codes are accessible and available on the internet. Interested readers may access and learn more.
1. Track your progress [Earn 200 points]
Mark as complete
2. Provide your ratings to this chapter [Earn 100 points]
- School Guide
- Mathematics
- Number System and Arithmetic
- Trigonometry
- Probability
- Mensuration
- Maths Formulas
- Class 8 Maths Notes
- Class 9 Maths Notes
- Class 10 Maths Notes
- Class 11 Maths Notes
- Class 12 Maths Notes
- What is a positive whole number less than 9?
- Is 0.4 a whole number?
- How many 3-digit numbers can be made with digits 1, 2, and 3?
- What is 6.5 as a whole number?
- What is the largest whole number which is less than 100?
- What is 2/7 as a whole number?
- Why do we use numbers?
- What is 0.5 as a whole number?
- What is 0.6 as a whole number?
- Find the smallest four digit number which is a perfect square
- What is 1/10 as a whole number?
- What is 1/8 as a whole number?
- What is Rhombus?
- Is 11 a whole number?
- What is the smallest 3 digit number?
- What is the common difference of the AP 1/b, (3-b)/3b, (3-2b)/3b...?
- How to find a term in a sequence?
- Is 17 a whole number?
- What is the sum of first 50 even numbers?
What are the different ways of Data Representation?
The process of collecting the data and analyzing that data in large quantity is known as statistics. It is a branch of mathematics trading with the collection, analysis, interpretation, and presentation of numeral facts and figures.
It is a numerical statement that helps us to collect and analyze the data in large quantity the statistics are based on two of its concepts:
- Statistical Data
- Statistical Science
Statistics must be expressed numerically and should be collected systematically.
Data Representation
The word data refers to constituting people, things, events, ideas. It can be a title, an integer, or anycast. After collecting data the investigator has to condense them in tabular form to study their salient features. Such an arrangement is known as the presentation of data.
It refers to the process of condensing the collected data in a tabular form or graphically. This arrangement of data is known as Data Representation.
The row can be placed in different orders like it can be presented in ascending orders, descending order, or can be presented in alphabetical order.
Example: Let the marks obtained by 10 students of class V in a class test, out of 50 according to their roll numbers, be: 39, 44, 49, 40, 22, 10, 45, 38, 15, 50 The data in the given form is known as raw data. The above given data can be placed in the serial order as shown below: Roll No. Marks 1 39 2 44 3 49 4 40 5 22 6 10 7 45 8 38 9 14 10 50 Now, if you want to analyse the standard of achievement of the students. If you arrange them in ascending or descending order, it will give you a better picture. Ascending order: 10, 15, 22, 38, 39, 40, 44. 45, 49, 50 Descending order: 50, 49, 45, 44, 40, 39, 38, 22, 15, 10 When the row is placed in ascending or descending order is known as arrayed data.
Types of Graphical Data Representation
Bar chart helps us to represent the collected data visually. The collected data can be visualized horizontally or vertically in a bar chart like amounts and frequency. It can be grouped or single. It helps us in comparing different items. By looking at all the bars, it is easy to say which types in a group of data influence the other.
Now let us understand bar chart by taking this example Let the marks obtained by 5 students of class V in a class test, out of 10 according to their names, be: 7,8,4,9,6 The data in the given form is known as raw data. The above given data can be placed in the bar chart as shown below: Name Marks Akshay 7 Maya 8 Dhanvi 4 Jaslen 9 Muskan 6
A histogram is the graphical representation of data. It is similar to the appearance of a bar graph but there is a lot of difference between histogram and bar graph because a bar graph helps to measure the frequency of categorical data. A categorical data means it is based on two or more categories like gender, months, etc. Whereas histogram is used for quantitative data.
For example:
The graph which uses lines and points to present the change in time is known as a line graph. Line graphs can be based on the number of animals left on earth, the increasing population of the world day by day, or the increasing or decreasing the number of bitcoins day by day, etc. The line graphs tell us about the changes occurring across the world over time. In a line graph, we can tell about two or more types of changes occurring around the world.
For Example:
Pie chart is a type of graph that involves a structural graphic representation of numerical proportion. It can be replaced in most cases by other plots like a bar chart, box plot, dot plot, etc. As per the research, it is shown that it is difficult to compare the different sections of a given pie chart, or if it is to compare data across different pie charts.
Frequency Distribution Table
A frequency distribution table is a chart that helps us to summarise the value and the frequency of the chart. This frequency distribution table has two columns, The first column consist of the list of the various outcome in the data, While the second column list the frequency of each outcome of the data. By putting this kind of data into a table it helps us to make it easier to understand and analyze the data.
For Example: To create a frequency distribution table, we would first need to list all the outcomes in the data. In this example, the results are 0 runs, 1 run, 2 runs, and 3 runs. We would list these numerals in numerical ranking in the foremost queue. Subsequently, we ought to calculate how many times per result happened. They scored 0 runs in the 1st, 4th, 7th, and 8th innings, 1 run in the 2nd, 5th, and the 9th innings, 2 runs in the 6th inning, and 3 runs in the 3rd inning. We set the frequency of each result in the double queue. You can notice that the table is a vastly more useful method to show this data. Baseball Team Runs Per Inning Number of Runs Frequency 0 4 1 3 2 1 3 1
Sample Questions
Question 1: Considering the school fee submission of 10 students of class 10th is given below:
In order to draw the bar graph for the data above, we prepare the frequency table as given below. Fee submission No. of Students Paid 6 Not paid 4 Now we have to represent the data by using the bar graph. It can be drawn by following the steps given below: Step 1: firstly we have to draw the two axis of the graph X-axis and the Y-axis. The varieties of the data must be put on the X-axis (the horizontal line) and the frequencies of the data must be put on the Y-axis (the vertical line) of the graph. Step 2: After drawing both the axis now we have to give the numeric scale to the Y-axis (the vertical line) of the graph It should be started from zero and ends up with the highest value of the data. Step 3: After the decision of the range at the Y-axis now we have to give it a suitable difference of the numeric scale. Like it can be 0,1,2,3…….or 0,10,20,30 either we can give it a numeric scale like 0,20,40,60… Step 4: Now on the X-axis we have to label it appropriately. Step 5: Now we have to draw the bars according to the data but we have to keep in mind that all the bars should be of the same length and there should be the same distance between each graph
Question 2: Watch the subsequent pie chart that denotes the money spent by Megha at the funfair. The suggested colour indicates the quantity paid for each variety. The total value of the data is 15 and the amount paid on each variety is diagnosed as follows:
Chocolates – 3
Wafers – 3
Toys – 2
Rides – 7
To convert this into pie chart percentage, we apply the formula: (Frequency/Total Frequency) × 100 Let us convert the above data into a percentage: Amount paid on rides: (7/15) × 100 = 47% Amount paid on toys: (2/15) × 100 = 13% Amount paid on wafers: (3/15) × 100 = 20% Amount paid on chocolates: (3/15) × 100 = 20 %
Question 3: The line graph given below shows how Devdas’s height changes as he grows.
Given below is a line graph showing the height changes in Devdas’s as he grows. Observe the graph and answer the questions below.

(i) What was the height of Devdas’s at 8 years? Answer: 65 inches (ii) What was the height of Devdas’s at 6 years? Answer: 50 inches (iii) What was the height of Devdas’s at 2 years? Answer: 35 inches (iv) How much has Devdas’s grown from 2 to 8 years? Answer: 30 inches (v) When was Devdas’s 35 inches tall? Answer: 2 years.
Please Login to comment...
Similar reads.
- School Learning

Improve your Coding Skills with Practice
What kind of Experience do you want to share?
Graphical Representation of Data
Graphical representation of data is an attractive method of showcasing numerical data that help in analyzing and representing quantitative data visually. A graph is a kind of a chart where data are plotted as variables across the coordinate. It became easy to analyze the extent of change of one variable based on the change of other variables. Graphical representation of data is done through different mediums such as lines, plots, diagrams, etc. Let us learn more about this interesting concept of graphical representation of data, the different types, and solve a few examples.
Definition of Graphical Representation of Data
A graphical representation is a visual representation of data statistics-based results using graphs, plots, and charts. This kind of representation is more effective in understanding and comparing data than seen in a tabular form. Graphical representation helps to qualify, sort, and present data in a method that is simple to understand for a larger audience. Graphs enable in studying the cause and effect relationship between two variables through both time series and frequency distribution. The data that is obtained from different surveying is infused into a graphical representation by the use of some symbols, such as lines on a line graph, bars on a bar chart, or slices of a pie chart. This visual representation helps in clarity, comparison, and understanding of numerical data.
Representation of Data
The word data is from the Latin word Datum, which means something given. The numerical figures collected through a survey are called data and can be represented in two forms - tabular form and visual form through graphs. Once the data is collected through constant observations, it is arranged, summarized, and classified to finally represented in the form of a graph. There are two kinds of data - quantitative and qualitative. Quantitative data is more structured, continuous, and discrete with statistical data whereas qualitative is unstructured where the data cannot be analyzed.
Principles of Graphical Representation of Data
The principles of graphical representation are algebraic. In a graph, there are two lines known as Axis or Coordinate axis. These are the X-axis and Y-axis. The horizontal axis is the X-axis and the vertical axis is the Y-axis. They are perpendicular to each other and intersect at O or point of Origin. On the right side of the Origin, the Xaxis has a positive value and on the left side, it has a negative value. In the same way, the upper side of the Origin Y-axis has a positive value where the down one is with a negative value. When -axis and y-axis intersect each other at the origin it divides the plane into four parts which are called Quadrant I, Quadrant II, Quadrant III, Quadrant IV. This form of representation is seen in a frequency distribution that is represented in four methods, namely Histogram, Smoothed frequency graph, Pie diagram or Pie chart, Cumulative or ogive frequency graph, and Frequency Polygon.

Advantages and Disadvantages of Graphical Representation of Data
Listed below are some advantages and disadvantages of using a graphical representation of data:
- It improves the way of analyzing and learning as the graphical representation makes the data easy to understand.
- It can be used in almost all fields from mathematics to physics to psychology and so on.
- It is easy to understand for its visual impacts.
- It shows the whole and huge data in an instance.
- It is mainly used in statistics to determine the mean, median, and mode for different data
The main disadvantage of graphical representation of data is that it takes a lot of effort as well as resources to find the most appropriate data and then represent it graphically.
Rules of Graphical Representation of Data
While presenting data graphically, there are certain rules that need to be followed. They are listed below:
- Suitable Title: The title of the graph should be appropriate that indicate the subject of the presentation.
- Measurement Unit: The measurement unit in the graph should be mentioned.
- Proper Scale: A proper scale needs to be chosen to represent the data accurately.
- Index: For better understanding, index the appropriate colors, shades, lines, designs in the graphs.
- Data Sources: Data should be included wherever it is necessary at the bottom of the graph.
- Simple: The construction of a graph should be easily understood.
- Neat: The graph should be visually neat in terms of size and font to read the data accurately.
Uses of Graphical Representation of Data
The main use of a graphical representation of data is understanding and identifying the trends and patterns of the data. It helps in analyzing large quantities, comparing two or more data, making predictions, and building a firm decision. The visual display of data also helps in avoiding confusion and overlapping of any information. Graphs like line graphs and bar graphs, display two or more data clearly for easy comparison. This is important in communicating our findings to others and our understanding and analysis of the data.
Types of Graphical Representation of Data
Data is represented in different types of graphs such as plots, pies, diagrams, etc. They are as follows,
Related Topics
Listed below are a few interesting topics that are related to the graphical representation of data, take a look.
- x and y graph
- Frequency Polygon
- Cumulative Frequency
Examples on Graphical Representation of Data
Example 1 : A pie chart is divided into 3 parts with the angles measuring as 2x, 8x, and 10x respectively. Find the value of x in degrees.
We know, the sum of all angles in a pie chart would give 360º as result. ⇒ 2x + 8x + 10x = 360º ⇒ 20 x = 360º ⇒ x = 360º/20 ⇒ x = 18º Therefore, the value of x is 18º.
Example 2: Ben is trying to read the plot given below. His teacher has given him stem and leaf plot worksheets. Can you help him answer the questions? i) What is the mode of the plot? ii) What is the mean of the plot? iii) Find the range.
Solution: i) Mode is the number that appears often in the data. Leaf 4 occurs twice on the plot against stem 5.
Hence, mode = 54
ii) The sum of all data values is 12 + 14 + 21 + 25 + 28 + 32 + 34 + 36 + 50 + 53 + 54 + 54 + 62 + 65 + 67 + 83 + 88 + 89 + 91 = 958
To find the mean, we have to divide the sum by the total number of values.
Mean = Sum of all data values ÷ 19 = 958 ÷ 19 = 50.42
iii) Range = the highest value - the lowest value = 91 - 12 = 79
go to slide go to slide

Book a Free Trial Class
Practice Questions on Graphical Representation of Data
Faqs on graphical representation of data, what is graphical representation.
Graphical representation is a form of visually displaying data through various methods like graphs, diagrams, charts, and plots. It helps in sorting, visualizing, and presenting data in a clear manner through different types of graphs. Statistics mainly use graphical representation to show data.
What are the Different Types of Graphical Representation?
The different types of graphical representation of data are:
- Stem and leaf plot
- Scatter diagrams
- Frequency Distribution
Is the Graphical Representation of Numerical Data?
Yes, these graphical representations are numerical data that has been accumulated through various surveys and observations. The method of presenting these numerical data is called a chart. There are different kinds of charts such as a pie chart, bar graph, line graph, etc, that help in clearly showcasing the data.
What is the Use of Graphical Representation of Data?
Graphical representation of data is useful in clarifying, interpreting, and analyzing data plotting points and drawing line segments , surfaces, and other geometric forms or symbols.
What are the Ways to Represent Data?
Tables, charts, and graphs are all ways of representing data, and they can be used for two broad purposes. The first is to support the collection, organization, and analysis of data as part of the process of a scientific study.
What is the Objective of Graphical Representation of Data?
The main objective of representing data graphically is to display information visually that helps in understanding the information efficiently, clearly, and accurately. This is important to communicate the findings as well as analyze the data.
Data representation learning via dictionary learning and self-representation
- Published: 31 August 2023
- Volume 53 , pages 26988–27000, ( 2023 )
Cite this article
- Deyu Zeng 1 , 2 ,
- Jing Sun 3 ,
- Zongze Wu 1 , 3 , 4 ,
- Chris Ding 5 &
- Zhigang Ren 3
264 Accesses
Explore all metrics
Dictionary learning is an effective feature learning method, leading to many remarkable results in data representation and classification tasks. However, dictionary learning is performed on the original data representation. In some cases, the capability of representation and discriminability of the learned dictionaries may need to be performed better, i.e., with only sparse but not low rank. In this paper, we propose a novel efficient data representation learning method by combining dictionary learning and self-representation, which utilizes both properties of sparsity in dictionary learning and low-rank in low-rank representation (LRR) simultaneously. Thus both the sparse and low-rank properties of the data representation can be naturally captured by our method. To obtain the solution of our proposed method effectively, we also innovatively introduce a more generalized data representation model in this paper. To our best knowledge, its closed-form solution is first derived analytically through our rigorous mathematical analysis. Experimental results show that our method not only can be used for data pre-processing but also can realize better dictionary learning. The samples in the same class can have similar representations by our method, and the discriminability of the learned dictionary can also be enhanced.
This is a preview of subscription content, log in via an institution to check access.
Access this article
Price excludes VAT (USA) Tax calculation will be finalised during checkout.
Instant access to the full article PDF.
Rent this article via DeepDyve
Institutional subscriptions
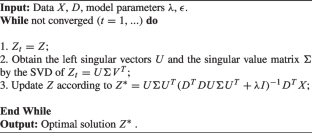
Feature dimensionality reduction: a review
Weikuan Jia, Meili Sun, … Sujuan Hou

Sparse Recovery of Hyperspectral Signal from Natural RGB Images

SSCNet: learning-based subspace clustering
Xingyu Xie, Jianlong Wu, … Zhouchen Lin
Data Availability Statement
Data is available on request from the authors.
http://www.cad.zju.edu.cn/home/dengcai/
http://www.cs.toronto.edu/~roweis/data.html
https://github.com/DeyuTsang/Data-Representation-Learning-via-Dictionary-Learning-and-Self-Representation .
Hastie T, Simard P (1997) Metrics and Models for Handwritten Character Recognition. Birkh user Basel
Vidal R (2011) Subspace clustering. Signal Proc Mag IEEE 28(2):52–68
Article Google Scholar
Wu Z, Liu S, Ding C, Ren Z, Xie S (2021) Learning graph similarity with large spectral gap. IEEE Trans Syst Man Cybern Syst 51(3):1590–1600
Wright J, Yang AY, Ganesh A, Sastry SS, Ma Y (2009) Robust face recognition via sparse representation. IEEE Trans Pattern Anal Mach Intell 31(2):210–227
Yang M, Zhang L (2010) Gabor feature based sparse representation for face recognition with gabor occlusion dictionary. In: European conference on computer vision pp 448–461
Zhao S, Yao H, Gao Y, Ji R, Ding G (2017) Continuous probability distribution prediction of image emotions via multitask shared sparse regression. IEEE Trans Multimed 19(3):632–645
Donoho DL (2000) High-dimensional data analysis: The curses and blessings of dimensionality
Gao Y, Ji R, Cui P, Dai Q, Hua G (2014) Hyperspectral image classification through bilayer graph-based learning. IEEE Trans Image Process 23(7):2769–2778
Article MathSciNet MATH Google Scholar
Peng X, Lu J, Yi Z, Yan R (2016) Automatic subspace learning via principal coefficients embedding. IEEE Trans Cybern 47(11):3583–3596
Chen CP, Liu Z (2017) Broad learning system: An effective and efficient incremental learning system without the need for deep architecture. IEEE Trans Neural Netw Learn Syst 29(1):10–24
Article MathSciNet Google Scholar
Chen B, Wang X, Lu N, Wang S, Cao J, Qin J (2018) Mixture correntropy for robust learning. Pattern Recognit 79:318–327
Wu Z, Su C, Yin M, Ren Z, Xie S (2021) Subspace clustering via stacked independent subspace analysis networks with sparse prior information. Pattern Recognit Lett 146:165–171
Xie Y, Qu Y, Tao D, Wu W, Yuan Q, Zhang W (2016) Hyperspectral image restoration via iteratively regularized weighted schatten -norm minimization. IEEE Trans Geosci Remote Sens 54:04
Chen J, Yi Z (2014) Subspace clustering by exploiting a low-rank representation with a symmetric constraint. Comput Sci
Ehsan E, Rene V (2013) Sparse subspace clustering: algorithm, theory, and applications. IEEE Trans Pattern Anal Mach Intell 35(11):2765–2781
Zhang Z, Xu Y, Yang J, Li X, Zhang D (2015) A survey of sparse representation: algorithms and applications. IEEE access 3:490–530
Liu G, Lin Z, Yu Y (2010) Robust subspace segmentation by low-rank representation. In: International conference on machine learning pp 663–670
Yang M, Zhang L, Feng X, Zhang D (2011) Fisher discrimination dictionary learning for sparse representation. Proceedings 24(4):543–550
Google Scholar
Aharon M, Elad M, Bruckstein A (2006) K-SVD: An algorithm for designing overcomplete dictionaries for sparse representation. IEEE Trans Signal Process 54(11):4311–4322
Article MATH Google Scholar
Gu S, Zhang L, Zuo W, Feng X (2014) Projective dictionary pair learning for pattern classification. Adv Nucl Inf Process Syst 1:793–801
Gangeh MJ, Ghodsi A, Kamel MS (2013) Kernelized supervised dictionary learning. IEEE Trans Signal Process 61(19):4753–4767
Li Z, Zhang Z, Qin J, Zhang Z, Shao L (2019) Discriminative fisher embedding dictionary learning algorithm for object recognition. IEEE Trans Neural Netw Learn Syst 31(3):786–800
Zhang Z, Lai Z, Xu Y, Shao L, Wu J, Xie G-S (2017) Discriminative elastic-net regularized linear regression. IEEE Trans Image Process 26(3):1466–1481
Guo L, Dai Q (2021) Laplacian regularized low-rank sparse representation transfer learning. Int J Mach Learn Cybern 12(3):807–821
Wang Y-X, Xu H, Leng C (2019) Provable subspace clustering: When lrr meets ssc. IEEE Trans Inf Theory 65(9):5406–5432
Liu G, Yan S (2011) Latent low-rank representation for subspace segmentation and feature extraction. In: 2011 International conference on computer vision. IEEE, pp 1615–1622
Luo D, Nie F, Ding C, Huang H (2011) Multi-subspace representation and discovery. In: Joint european conference on machine learning and knowledge discovery in databases. pp 405–420
Ding Y, Chong Y, Pan S (2020) Sparse and low-rank representation with key connectivity for hyperspectral image classification. IEEE J Sel Top Appl Earth Obs Remote Sens 13:5609–5622
Chen J, Mao H, Wang Z, Zhang X (2021) Low-rank representation with adaptive dictionary learning for subspace clustering. Knowl-Based Syst 223:107053
Roweis ST, Saul LK (2000) Nonlinear dimensionality reduction by locally linear embedding. Science 290(5500):2323–2326
Elhamifar E, René V (2009) Sparse subspace clustering. In: 2009 IEEE Conference on Computer Vision and Pattern Recognition (CVPR), vol 00, vol 6, pp 2790–2797
Masaeli M, Yan Y, Cui Y, Fung G, Dy JG (2010) Convex principal feature selection. In: Proceedings of the 2010 SIAM international conference on data mining. SIAM, pp 619–628
Candès EJ, Li X, Ma Y, Wright J (2011) Robust principal component analysis? J ACM (JACM) 58(3):1–37
Favaro P, Vidal R, Ravichandran A (2011) A closed form solution to robust subspace estimation and clustering. In: CVPR 2011. IEEE, pp 1801–1807
Yu YL, Schuurmans D (2012) Rankrm regularization with closed-form solutions: application to subspace clustering. Comput Sci abs/1202.3772
Zhang H, Zhang Y, Huang TS (2013) Robust face recognition via sparse representation. Pattern Recognit 46(5):1511–1521
Download references
Acknowledgements
This work was supported in part by the Grants of National Key R &D Program of China- 2020AAA0108302, and the Shenzhen University 2035 Program for Excellent Research (00000224).
Author information
Authors and affiliations.
College of Mechatronics and Control Engineering, Shenzhen University, Shenzhen, 518060, China
Deyu Zeng & Zongze Wu
College of Computer Science and Software Engineering, Shenzhen University, Shenzhen, 518060, China
School of Automation, Guangdong University of Technology, Guangzhou, 510006, China
Jing Sun, Zongze Wu & Zhigang Ren
Guangdong Laboratory of Artificial Intelligence and Digital Economy (SZ), Shenzhen University, Shenzhen, 518060, China
School of Data Science, Chinese University of Hong Kong (Shenzhen), Shenzhen, 518172, China
You can also search for this author in PubMed Google Scholar
Corresponding author
Correspondence to Zongze Wu .
Ethics declarations
Conflict of interest.
The authors declare that there is no conflict of interest that could be perceived as prejudicing the impartiality of the research reported.
Additional information
Publisher's note.
Springer Nature remains neutral with regard to jurisdictional claims in published maps and institutional affiliations.
Rights and permissions
Springer Nature or its licensor (e.g. a society or other partner) holds exclusive rights to this article under a publishing agreement with the author(s) or other rightsholder(s); author self-archiving of the accepted manuscript version of this article is solely governed by the terms of such publishing agreement and applicable law.
Reprints and permissions
About this article
Zeng, D., Sun, J., Wu, Z. et al. Data representation learning via dictionary learning and self-representation. Appl Intell 53 , 26988–27000 (2023). https://doi.org/10.1007/s10489-023-04902-z
Download citation
Accepted : 21 July 2023
Published : 31 August 2023
Issue Date : November 2023
DOI : https://doi.org/10.1007/s10489-023-04902-z
Share this article
Anyone you share the following link with will be able to read this content:
Sorry, a shareable link is not currently available for this article.
Provided by the Springer Nature SharedIt content-sharing initiative
- Dictionary learning
- Low-rank representation
- Data representation
- Self-representation
- Find a journal
- Publish with us
- Track your research
A Guide To The Methods, Benefits & Problems of The Interpretation of Data

Table of Contents
1) What Is Data Interpretation?
2) How To Interpret Data?
3) Why Data Interpretation Is Important?
4) Data Interpretation Skills
5) Data Analysis & Interpretation Problems
6) Data Interpretation Techniques & Methods
7) The Use of Dashboards For Data Interpretation
8) Business Data Interpretation Examples
Data analysis and interpretation have now taken center stage with the advent of the digital age… and the sheer amount of data can be frightening. In fact, a Digital Universe study found that the total data supply in 2012 was 2.8 trillion gigabytes! Based on that amount of data alone, it is clear the calling card of any successful enterprise in today’s global world will be the ability to analyze complex data, produce actionable insights, and adapt to new market needs… all at the speed of thought.
Business dashboards are the digital age tools for big data. Capable of displaying key performance indicators (KPIs) for both quantitative and qualitative data analyses, they are ideal for making the fast-paced and data-driven market decisions that push today’s industry leaders to sustainable success. Through the art of streamlined visual communication, data dashboards permit businesses to engage in real-time and informed decision-making and are key instruments in data interpretation. First of all, let’s find a definition to understand what lies behind this practice.
What Is Data Interpretation?
Data interpretation refers to the process of using diverse analytical methods to review data and arrive at relevant conclusions. The interpretation of data helps researchers to categorize, manipulate, and summarize the information in order to answer critical questions.
The importance of data interpretation is evident, and this is why it needs to be done properly. Data is very likely to arrive from multiple sources and has a tendency to enter the analysis process with haphazard ordering. Data analysis tends to be extremely subjective. That is to say, the nature and goal of interpretation will vary from business to business, likely correlating to the type of data being analyzed. While there are several types of processes that are implemented based on the nature of individual data, the two broadest and most common categories are “quantitative and qualitative analysis.”
Yet, before any serious data interpretation inquiry can begin, it should be understood that visual presentations of data findings are irrelevant unless a sound decision is made regarding measurement scales. Before any serious data analysis can begin, the measurement scale must be decided for the data as this will have a long-term impact on data interpretation ROI. The varying scales include:
- Nominal Scale: non-numeric categories that cannot be ranked or compared quantitatively. Variables are exclusive and exhaustive.
- Ordinal Scale: exclusive categories that are exclusive and exhaustive but with a logical order. Quality ratings and agreement ratings are examples of ordinal scales (i.e., good, very good, fair, etc., OR agree, strongly agree, disagree, etc.).
- Interval: a measurement scale where data is grouped into categories with orderly and equal distances between the categories. There is always an arbitrary zero point.
- Ratio: contains features of all three.
For a more in-depth review of scales of measurement, read our article on data analysis questions . Once measurement scales have been selected, it is time to select which of the two broad interpretation processes will best suit your data needs. Let’s take a closer look at those specific methods and possible data interpretation problems.
How To Interpret Data? Top Methods & Techniques

When interpreting data, an analyst must try to discern the differences between correlation, causation, and coincidences, as well as many other biases – but he also has to consider all the factors involved that may have led to a result. There are various data interpretation types and methods one can use to achieve this.
The interpretation of data is designed to help people make sense of numerical data that has been collected, analyzed, and presented. Having a baseline method for interpreting data will provide your analyst teams with a structure and consistent foundation. Indeed, if several departments have different approaches to interpreting the same data while sharing the same goals, some mismatched objectives can result. Disparate methods will lead to duplicated efforts, inconsistent solutions, wasted energy, and inevitably – time and money. In this part, we will look at the two main methods of interpretation of data: qualitative and quantitative analysis.
Qualitative Data Interpretation
Qualitative data analysis can be summed up in one word – categorical. With this type of analysis, data is not described through numerical values or patterns but through the use of descriptive context (i.e., text). Typically, narrative data is gathered by employing a wide variety of person-to-person techniques. These techniques include:
- Observations: detailing behavioral patterns that occur within an observation group. These patterns could be the amount of time spent in an activity, the type of activity, and the method of communication employed.
- Focus groups: Group people and ask them relevant questions to generate a collaborative discussion about a research topic.
- Secondary Research: much like how patterns of behavior can be observed, various types of documentation resources can be coded and divided based on the type of material they contain.
- Interviews: one of the best collection methods for narrative data. Inquiry responses can be grouped by theme, topic, or category. The interview approach allows for highly focused data segmentation.
A key difference between qualitative and quantitative analysis is clearly noticeable in the interpretation stage. The first one is widely open to interpretation and must be “coded” so as to facilitate the grouping and labeling of data into identifiable themes. As person-to-person data collection techniques can often result in disputes pertaining to proper analysis, qualitative data analysis is often summarized through three basic principles: notice things, collect things, and think about things.
After qualitative data has been collected through transcripts, questionnaires, audio and video recordings, or the researcher’s notes, it is time to interpret it. For that purpose, there are some common methods used by researchers and analysts.
- Content analysis : As its name suggests, this is a research method used to identify frequencies and recurring words, subjects, and concepts in image, video, or audio content. It transforms qualitative information into quantitative data to help discover trends and conclusions that will later support important research or business decisions. This method is often used by marketers to understand brand sentiment from the mouths of customers themselves. Through that, they can extract valuable information to improve their products and services. It is recommended to use content analytics tools for this method as manually performing it is very time-consuming and can lead to human error or subjectivity issues. Having a clear goal in mind before diving into it is another great practice for avoiding getting lost in the fog.
- Thematic analysis: This method focuses on analyzing qualitative data, such as interview transcripts, survey questions, and others, to identify common patterns and separate the data into different groups according to found similarities or themes. For example, imagine you want to analyze what customers think about your restaurant. For this purpose, you do a thematic analysis on 1000 reviews and find common themes such as “fresh food”, “cold food”, “small portions”, “friendly staff”, etc. With those recurring themes in hand, you can extract conclusions about what could be improved or enhanced based on your customer’s experiences. Since this technique is more exploratory, be open to changing your research questions or goals as you go.
- Narrative analysis: A bit more specific and complicated than the two previous methods, it is used to analyze stories and discover their meaning. These stories can be extracted from testimonials, case studies, and interviews, as these formats give people more space to tell their experiences. Given that collecting this kind of data is harder and more time-consuming, sample sizes for narrative analysis are usually smaller, which makes it harder to reproduce its findings. However, it is still a valuable technique for understanding customers' preferences and mindsets.
- Discourse analysis : This method is used to draw the meaning of any type of visual, written, or symbolic language in relation to a social, political, cultural, or historical context. It is used to understand how context can affect how language is carried out and understood. For example, if you are doing research on power dynamics, using discourse analysis to analyze a conversation between a janitor and a CEO and draw conclusions about their responses based on the context and your research questions is a great use case for this technique. That said, like all methods in this section, discourse analytics is time-consuming as the data needs to be analyzed until no new insights emerge.
- Grounded theory analysis : The grounded theory approach aims to create or discover a new theory by carefully testing and evaluating the data available. Unlike all other qualitative approaches on this list, grounded theory helps extract conclusions and hypotheses from the data instead of going into the analysis with a defined hypothesis. This method is very popular amongst researchers, analysts, and marketers as the results are completely data-backed, providing a factual explanation of any scenario. It is often used when researching a completely new topic or with little knowledge as this space to start from the ground up.
Quantitative Data Interpretation
If quantitative data interpretation could be summed up in one word (and it really can’t), that word would be “numerical.” There are few certainties when it comes to data analysis, but you can be sure that if the research you are engaging in has no numbers involved, it is not quantitative research, as this analysis refers to a set of processes by which numerical data is analyzed. More often than not, it involves the use of statistical modeling such as standard deviation, mean, and median. Let’s quickly review the most common statistical terms:
- Mean: A mean represents a numerical average for a set of responses. When dealing with a data set (or multiple data sets), a mean will represent the central value of a specific set of numbers. It is the sum of the values divided by the number of values within the data set. Other terms that can be used to describe the concept are arithmetic mean, average, and mathematical expectation.
- Standard deviation: This is another statistical term commonly used in quantitative analysis. Standard deviation reveals the distribution of the responses around the mean. It describes the degree of consistency within the responses; together with the mean, it provides insight into data sets.
- Frequency distribution: This is a measurement gauging the rate of a response appearance within a data set. When using a survey, for example, frequency distribution, it can determine the number of times a specific ordinal scale response appears (i.e., agree, strongly agree, disagree, etc.). Frequency distribution is extremely keen in determining the degree of consensus among data points.
Typically, quantitative data is measured by visually presenting correlation tests between two or more variables of significance. Different processes can be used together or separately, and comparisons can be made to ultimately arrive at a conclusion. Other signature interpretation processes of quantitative data include:
- Regression analysis: Essentially, it uses historical data to understand the relationship between a dependent variable and one or more independent variables. Knowing which variables are related and how they developed in the past allows you to anticipate possible outcomes and make better decisions going forward. For example, if you want to predict your sales for next month, you can use regression to understand what factors will affect them, such as products on sale and the launch of a new campaign, among many others.
- Cohort analysis: This method identifies groups of users who share common characteristics during a particular time period. In a business scenario, cohort analysis is commonly used to understand customer behaviors. For example, a cohort could be all users who have signed up for a free trial on a given day. An analysis would be carried out to see how these users behave, what actions they carry out, and how their behavior differs from other user groups.
- Predictive analysis: As its name suggests, the predictive method aims to predict future developments by analyzing historical and current data. Powered by technologies such as artificial intelligence and machine learning, predictive analytics practices enable businesses to identify patterns or potential issues and plan informed strategies in advance.
- Prescriptive analysis: Also powered by predictions, the prescriptive method uses techniques such as graph analysis, complex event processing, and neural networks, among others, to try to unravel the effect that future decisions will have in order to adjust them before they are actually made. This helps businesses to develop responsive, practical business strategies.
- Conjoint analysis: Typically applied to survey analysis, the conjoint approach is used to analyze how individuals value different attributes of a product or service. This helps researchers and businesses to define pricing, product features, packaging, and many other attributes. A common use is menu-based conjoint analysis, in which individuals are given a “menu” of options from which they can build their ideal concept or product. Through this, analysts can understand which attributes they would pick above others and drive conclusions.
- Cluster analysis: Last but not least, the cluster is a method used to group objects into categories. Since there is no target variable when using cluster analysis, it is a useful method to find hidden trends and patterns in the data. In a business context, clustering is used for audience segmentation to create targeted experiences. In market research, it is often used to identify age groups, geographical information, and earnings, among others.
Now that we have seen how to interpret data, let's move on and ask ourselves some questions: What are some of the benefits of data interpretation? Why do all industries engage in data research and analysis? These are basic questions, but they often don’t receive adequate attention.
Your Chance: Want to test a powerful data analysis software? Use our 14-days free trial & start extracting insights from your data!
Why Data Interpretation Is Important

The purpose of collection and interpretation is to acquire useful and usable information and to make the most informed decisions possible. From businesses to newlyweds researching their first home, data collection and interpretation provide limitless benefits for a wide range of institutions and individuals.
Data analysis and interpretation, regardless of the method and qualitative/quantitative status, may include the following characteristics:
- Data identification and explanation
- Comparing and contrasting data
- Identification of data outliers
- Future predictions
Data analysis and interpretation, in the end, help improve processes and identify problems. It is difficult to grow and make dependable improvements without, at the very least, minimal data collection and interpretation. What is the keyword? Dependable. Vague ideas regarding performance enhancement exist within all institutions and industries. Yet, without proper research and analysis, an idea is likely to remain in a stagnant state forever (i.e., minimal growth). So… what are a few of the business benefits of digital age data analysis and interpretation? Let’s take a look!
1) Informed decision-making: A decision is only as good as the knowledge that formed it. Informed data decision-making can potentially set industry leaders apart from the rest of the market pack. Studies have shown that companies in the top third of their industries are, on average, 5% more productive and 6% more profitable when implementing informed data decision-making processes. Most decisive actions will arise only after a problem has been identified or a goal defined. Data analysis should include identification, thesis development, and data collection, followed by data communication.
If institutions only follow that simple order, one that we should all be familiar with from grade school science fairs, then they will be able to solve issues as they emerge in real-time. Informed decision-making has a tendency to be cyclical. This means there is really no end, and eventually, new questions and conditions arise within the process that need to be studied further. The monitoring of data results will inevitably return the process to the start with new data and sights.
2) Anticipating needs with trends identification: data insights provide knowledge, and knowledge is power. The insights obtained from market and consumer data analyses have the ability to set trends for peers within similar market segments. A perfect example of how data analytics can impact trend prediction is evidenced in the music identification application Shazam . The application allows users to upload an audio clip of a song they like but can’t seem to identify. Users make 15 million song identifications a day. With this data, Shazam has been instrumental in predicting future popular artists.
When industry trends are identified, they can then serve a greater industry purpose. For example, the insights from Shazam’s monitoring benefits not only Shazam in understanding how to meet consumer needs but also grant music executives and record label companies an insight into the pop-culture scene of the day. Data gathering and interpretation processes can allow for industry-wide climate prediction and result in greater revenue streams across the market. For this reason, all institutions should follow the basic data cycle of collection, interpretation, decision-making, and monitoring.
3) Cost efficiency: Proper implementation of analytics processes can provide businesses with profound cost advantages within their industries. A recent data study performed by Deloitte vividly demonstrates this in finding that data analysis ROI is driven by efficient cost reductions. Often, this benefit is overlooked because making money is typically viewed as “sexier” than saving money. Yet, sound data analyses have the ability to alert management to cost-reduction opportunities without any significant exertion of effort on the part of human capital.
A great example of the potential for cost efficiency through data analysis is Intel. Prior to 2012, Intel would conduct over 19,000 manufacturing function tests on their chips before they could be deemed acceptable for release. To cut costs and reduce test time, Intel implemented predictive data analyses. By using historical and current data, Intel now avoids testing each chip 19,000 times by focusing on specific and individual chip tests. After its implementation in 2012, Intel saved over $3 million in manufacturing costs. Cost reduction may not be as “sexy” as data profit, but as Intel proves, it is a benefit of data analysis that should not be neglected.
4) Clear foresight: companies that collect and analyze their data gain better knowledge about themselves, their processes, and their performance. They can identify performance challenges when they arise and take action to overcome them. Data interpretation through visual representations lets them process their findings faster and make better-informed decisions on the company's future.
Key Data Interpretation Skills You Should Have
Just like any other process, data interpretation and analysis require researchers or analysts to have some key skills to be able to perform successfully. It is not enough just to apply some methods and tools to the data; the person who is managing it needs to be objective and have a data-driven mind, among other skills.
It is a common misconception to think that the required skills are mostly number-related. While data interpretation is heavily analytically driven, it also requires communication and narrative skills, as the results of the analysis need to be presented in a way that is easy to understand for all types of audiences.
Luckily, with the rise of self-service tools and AI-driven technologies, data interpretation is no longer segregated for analysts only. However, the topic still remains a big challenge for businesses that make big investments in data and tools to support it, as the interpretation skills required are still lacking. It is worthless to put massive amounts of money into extracting information if you are not going to be able to interpret what that information is telling you. For that reason, below we list the top 5 data interpretation skills your employees or researchers should have to extract the maximum potential from the data.
- Data Literacy: The first and most important skill to have is data literacy. This means having the ability to understand, work, and communicate with data. It involves knowing the types of data sources, methods, and ethical implications of using them. In research, this skill is often a given. However, in a business context, there might be many employees who are not comfortable with data. The issue is the interpretation of data can not be solely responsible for the data team, as it is not sustainable in the long run. Experts advise business leaders to carefully assess the literacy level across their workforce and implement training instances to ensure everyone can interpret their data.
- Data Tools: The data interpretation and analysis process involves using various tools to collect, clean, store, and analyze the data. The complexity of the tools varies depending on the type of data and the analysis goals. Going from simple ones like Excel to more complex ones like databases, such as SQL, or programming languages, such as R or Python. It also involves visual analytics tools to bring the data to life through the use of graphs and charts. Managing these tools is a fundamental skill as they make the process faster and more efficient. As mentioned before, most modern solutions are now self-service, enabling less technical users to use them without problem.
- Critical Thinking: Another very important skill is to have critical thinking. Data hides a range of conclusions, trends, and patterns that must be discovered. It is not just about comparing numbers; it is about putting a story together based on multiple factors that will lead to a conclusion. Therefore, having the ability to look further from what is right in front of you is an invaluable skill for data interpretation.
- Data Ethics: In the information age, being aware of the legal and ethical responsibilities that come with the use of data is of utmost importance. In short, data ethics involves respecting the privacy and confidentiality of data subjects, as well as ensuring accuracy and transparency for data usage. It requires the analyzer or researcher to be completely objective with its interpretation to avoid any biases or discrimination. Many countries have already implemented regulations regarding the use of data, including the GDPR or the ACM Code Of Ethics. Awareness of these regulations and responsibilities is a fundamental skill that anyone working in data interpretation should have.
- Domain Knowledge: Another skill that is considered important when interpreting data is to have domain knowledge. As mentioned before, data hides valuable insights that need to be uncovered. To do so, the analyst needs to know about the industry or domain from which the information is coming and use that knowledge to explore it and put it into a broader context. This is especially valuable in a business context, where most departments are now analyzing data independently with the help of a live dashboard instead of relying on the IT department, which can often overlook some aspects due to a lack of expertise in the topic.
Common Data Analysis And Interpretation Problems

The oft-repeated mantra of those who fear data advancements in the digital age is “big data equals big trouble.” While that statement is not accurate, it is safe to say that certain data interpretation problems or “pitfalls” exist and can occur when analyzing data, especially at the speed of thought. Let’s identify some of the most common data misinterpretation risks and shed some light on how they can be avoided:
1) Correlation mistaken for causation: our first misinterpretation of data refers to the tendency of data analysts to mix the cause of a phenomenon with correlation. It is the assumption that because two actions occurred together, one caused the other. This is inaccurate, as actions can occur together, absent a cause-and-effect relationship.
- Digital age example: assuming that increased revenue results from increased social media followers… there might be a definitive correlation between the two, especially with today’s multi-channel purchasing experiences. But that does not mean an increase in followers is the direct cause of increased revenue. There could be both a common cause and an indirect causality.
- Remedy: attempt to eliminate the variable you believe to be causing the phenomenon.
2) Confirmation bias: our second problem is data interpretation bias. It occurs when you have a theory or hypothesis in mind but are intent on only discovering data patterns that support it while rejecting those that do not.
- Digital age example: your boss asks you to analyze the success of a recent multi-platform social media marketing campaign. While analyzing the potential data variables from the campaign (one that you ran and believe performed well), you see that the share rate for Facebook posts was great, while the share rate for Twitter Tweets was not. Using only Facebook posts to prove your hypothesis that the campaign was successful would be a perfect manifestation of confirmation bias.
- Remedy: as this pitfall is often based on subjective desires, one remedy would be to analyze data with a team of objective individuals. If this is not possible, another solution is to resist the urge to make a conclusion before data exploration has been completed. Remember to always try to disprove a hypothesis, not prove it.
3) Irrelevant data: the third data misinterpretation pitfall is especially important in the digital age. As large data is no longer centrally stored and as it continues to be analyzed at the speed of thought, it is inevitable that analysts will focus on data that is irrelevant to the problem they are trying to correct.
- Digital age example: in attempting to gauge the success of an email lead generation campaign, you notice that the number of homepage views directly resulting from the campaign increased, but the number of monthly newsletter subscribers did not. Based on the number of homepage views, you decide the campaign was a success when really it generated zero leads.
- Remedy: proactively and clearly frame any data analysis variables and KPIs prior to engaging in a data review. If the metric you use to measure the success of a lead generation campaign is newsletter subscribers, there is no need to review the number of homepage visits. Be sure to focus on the data variable that answers your question or solves your problem and not on irrelevant data.
4) Truncating an Axes: When creating a graph to start interpreting the results of your analysis, it is important to keep the axes truthful and avoid generating misleading visualizations. Starting the axes in a value that doesn’t portray the actual truth about the data can lead to false conclusions.
- Digital age example: In the image below, we can see a graph from Fox News in which the Y-axes start at 34%, making it seem that the difference between 35% and 39.6% is way higher than it actually is. This could lead to a misinterpretation of the tax rate changes.

* Source : www.venngage.com *
- Remedy: Be careful with how your data is visualized. Be respectful and realistic with axes to avoid misinterpretation of your data. See below how the Fox News chart looks when using the correct axis values. This chart was created with datapine's modern online data visualization tool.

5) (Small) sample size: Another common problem is using a small sample size. Logically, the bigger the sample size, the more accurate and reliable the results. However, this also depends on the size of the effect of the study. For example, the sample size in a survey about the quality of education will not be the same as for one about people doing outdoor sports in a specific area.
- Digital age example: Imagine you ask 30 people a question, and 29 answer “yes,” resulting in 95% of the total. Now imagine you ask the same question to 1000, and 950 of them answer “yes,” which is again 95%. While these percentages might look the same, they certainly do not mean the same thing, as a 30-person sample size is not a significant number to establish a truthful conclusion.
- Remedy: Researchers say that in order to determine the correct sample size to get truthful and meaningful results, it is necessary to define a margin of error that will represent the maximum amount they want the results to deviate from the statistical mean. Paired with this, they need to define a confidence level that should be between 90 and 99%. With these two values in hand, researchers can calculate an accurate sample size for their studies.
6) Reliability, subjectivity, and generalizability : When performing qualitative analysis, researchers must consider practical and theoretical limitations when interpreting the data. In some cases, this type of research can be considered unreliable because of uncontrolled factors that might or might not affect the results. This is paired with the fact that the researcher has a primary role in the interpretation process, meaning he or she decides what is relevant and what is not, and as we know, interpretations can be very subjective.
Generalizability is also an issue that researchers face when dealing with qualitative analysis. As mentioned in the point about having a small sample size, it is difficult to draw conclusions that are 100% representative because the results might be biased or unrepresentative of a wider population.
While these factors are mostly present in qualitative research, they can also affect the quantitative analysis. For example, when choosing which KPIs to portray and how to portray them, analysts can also be biased and represent them in a way that benefits their analysis.
- Digital age example: Biased questions in a survey are a great example of reliability and subjectivity issues. Imagine you are sending a survey to your clients to see how satisfied they are with your customer service with this question: “How amazing was your experience with our customer service team?”. Here, we can see that this question clearly influences the response of the individual by putting the word “amazing” on it.
- Remedy: A solution to avoid these issues is to keep your research honest and neutral. Keep the wording of the questions as objective as possible. For example: “On a scale of 1-10, how satisfied were you with our customer service team?”. This does not lead the respondent to any specific answer, meaning the results of your survey will be reliable.
Data Interpretation Best Practices & Tips

Data analysis and interpretation are critical to developing sound conclusions and making better-informed decisions. As we have seen with this article, there is an art and science to the interpretation of data. To help you with this purpose, we will list a few relevant techniques, methods, and tricks you can implement for a successful data management process.
As mentioned at the beginning of this post, the first step to interpreting data in a successful way is to identify the type of analysis you will perform and apply the methods respectively. Clearly differentiate between qualitative (observe, document, and interview notice, collect and think about things) and quantitative analysis (you lead research with a lot of numerical data to be analyzed through various statistical methods).
1) Ask the right data interpretation questions
The first data interpretation technique is to define a clear baseline for your work. This can be done by answering some critical questions that will serve as a useful guideline to start. Some of them include: what are the goals and objectives of my analysis? What type of data interpretation method will I use? Who will use this data in the future? And most importantly, what general question am I trying to answer?
Once all this information has been defined, you will be ready for the next step: collecting your data.
2) Collect and assimilate your data
Now that a clear baseline has been established, it is time to collect the information you will use. Always remember that your methods for data collection will vary depending on what type of analysis method you use, which can be qualitative or quantitative. Based on that, relying on professional online data analysis tools to facilitate the process is a great practice in this regard, as manually collecting and assessing raw data is not only very time-consuming and expensive but is also at risk of errors and subjectivity.
Once your data is collected, you need to carefully assess it to understand if the quality is appropriate to be used during a study. This means, is the sample size big enough? Were the procedures used to collect the data implemented correctly? Is the date range from the data correct? If coming from an external source, is it a trusted and objective one?
With all the needed information in hand, you are ready to start the interpretation process, but first, you need to visualize your data.
3) Use the right data visualization type
Data visualizations such as business graphs , charts, and tables are fundamental to successfully interpreting data. This is because data visualization via interactive charts and graphs makes the information more understandable and accessible. As you might be aware, there are different types of visualizations you can use, but not all of them are suitable for any analysis purpose. Using the wrong graph can lead to misinterpretation of your data, so it’s very important to carefully pick the right visual for it. Let’s look at some use cases of common data visualizations.
- Bar chart: One of the most used chart types, the bar chart uses rectangular bars to show the relationship between 2 or more variables. There are different types of bar charts for different interpretations, including the horizontal bar chart, column bar chart, and stacked bar chart.
- Line chart: Most commonly used to show trends, acceleration or decelerations, and volatility, the line chart aims to show how data changes over a period of time, for example, sales over a year. A few tips to keep this chart ready for interpretation are not using many variables that can overcrowd the graph and keeping your axis scale close to the highest data point to avoid making the information hard to read.
- Pie chart: Although it doesn’t do a lot in terms of analysis due to its uncomplex nature, pie charts are widely used to show the proportional composition of a variable. Visually speaking, showing a percentage in a bar chart is way more complicated than showing it in a pie chart. However, this also depends on the number of variables you are comparing. If your pie chart needs to be divided into 10 portions, then it is better to use a bar chart instead.
- Tables: While they are not a specific type of chart, tables are widely used when interpreting data. Tables are especially useful when you want to portray data in its raw format. They give you the freedom to easily look up or compare individual values while also displaying grand totals.
With the use of data visualizations becoming more and more critical for businesses’ analytical success, many tools have emerged to help users visualize their data in a cohesive and interactive way. One of the most popular ones is the use of BI dashboards . These visual tools provide a centralized view of various graphs and charts that paint a bigger picture of a topic. We will discuss the power of dashboards for an efficient data interpretation practice in the next portion of this post. If you want to learn more about different types of graphs and charts , take a look at our complete guide on the topic.
4) Start interpreting
After the tedious preparation part, you can start extracting conclusions from your data. As mentioned many times throughout the post, the way you decide to interpret the data will solely depend on the methods you initially decided to use. If you had initial research questions or hypotheses, then you should look for ways to prove their validity. If you are going into the data with no defined hypothesis, then start looking for relationships and patterns that will allow you to extract valuable conclusions from the information.
During the process of interpretation, stay curious and creative, dig into the data, and determine if there are any other critical questions that should be asked. If any new questions arise, you need to assess if you have the necessary information to answer them. Being able to identify if you need to dedicate more time and resources to the research is a very important step. No matter if you are studying customer behaviors or a new cancer treatment, the findings from your analysis may dictate important decisions in the future. Therefore, taking the time to really assess the information is key. For that purpose, data interpretation software proves to be very useful.
5) Keep your interpretation objective
As mentioned above, objectivity is one of the most important data interpretation skills but also one of the hardest. Being the person closest to the investigation, it is easy to become subjective when looking for answers in the data. A good way to stay objective is to show the information related to the study to other people, for example, research partners or even the people who will use your findings once they are done. This can help avoid confirmation bias and any reliability issues with your interpretation.
Remember, using a visualization tool such as a modern dashboard will make the interpretation process way easier and more efficient as the data can be navigated and manipulated in an easy and organized way. And not just that, using a dashboard tool to present your findings to a specific audience will make the information easier to understand and the presentation way more engaging thanks to the visual nature of these tools.
6) Mark your findings and draw conclusions
Findings are the observations you extracted from your data. They are the facts that will help you drive deeper conclusions about your research. For example, findings can be trends and patterns you found during your interpretation process. To put your findings into perspective, you can compare them with other resources that use similar methods and use them as benchmarks.
Reflect on your own thinking and reasoning and be aware of the many pitfalls data analysis and interpretation carry—correlation versus causation, subjective bias, false information, inaccurate data, etc. Once you are comfortable with interpreting the data, you will be ready to develop conclusions, see if your initial questions were answered, and suggest recommendations based on them.
Interpretation of Data: The Use of Dashboards Bridging The Gap
As we have seen, quantitative and qualitative methods are distinct types of data interpretation and analysis. Both offer a varying degree of return on investment (ROI) regarding data investigation, testing, and decision-making. But how do you mix the two and prevent a data disconnect? The answer is professional data dashboards.
For a few years now, dashboards have become invaluable tools to visualize and interpret data. These tools offer a centralized and interactive view of data and provide the perfect environment for exploration and extracting valuable conclusions. They bridge the quantitative and qualitative information gap by unifying all the data in one place with the help of stunning visuals.
Not only that, but these powerful tools offer a large list of benefits, and we will discuss some of them below.
1) Connecting and blending data. With today’s pace of innovation, it is no longer feasible (nor desirable) to have bulk data centrally located. As businesses continue to globalize and borders continue to dissolve, it will become increasingly important for businesses to possess the capability to run diverse data analyses absent the limitations of location. Data dashboards decentralize data without compromising on the necessary speed of thought while blending both quantitative and qualitative data. Whether you want to measure customer trends or organizational performance, you now have the capability to do both without the need for a singular selection.
2) Mobile Data. Related to the notion of “connected and blended data” is that of mobile data. In today’s digital world, employees are spending less time at their desks and simultaneously increasing production. This is made possible because mobile solutions for analytical tools are no longer standalone. Today, mobile analysis applications seamlessly integrate with everyday business tools. In turn, both quantitative and qualitative data are now available on-demand where they’re needed, when they’re needed, and how they’re needed via interactive online dashboards .
3) Visualization. Data dashboards merge the data gap between qualitative and quantitative data interpretation methods through the science of visualization. Dashboard solutions come “out of the box” and are well-equipped to create easy-to-understand data demonstrations. Modern online data visualization tools provide a variety of color and filter patterns, encourage user interaction, and are engineered to help enhance future trend predictability. All of these visual characteristics make for an easy transition among data methods – you only need to find the right types of data visualization to tell your data story the best way possible.
4) Collaboration. Whether in a business environment or a research project, collaboration is key in data interpretation and analysis. Dashboards are online tools that can be easily shared through a password-protected URL or automated email. Through them, users can collaborate and communicate through the data in an efficient way. Eliminating the need for infinite files with lost updates. Tools such as datapine offer real-time updates, meaning your dashboards will update on their own as soon as new information is available.
Examples Of Data Interpretation In Business
To give you an idea of how a dashboard can fulfill the need to bridge quantitative and qualitative analysis and help in understanding how to interpret data in research thanks to visualization, below, we will discuss three valuable examples to put their value into perspective.
1. Customer Satisfaction Dashboard
This market research dashboard brings together both qualitative and quantitative data that are knowledgeably analyzed and visualized in a meaningful way that everyone can understand, thus empowering any viewer to interpret it. Let’s explore it below.

**click to enlarge**
The value of this template lies in its highly visual nature. As mentioned earlier, visuals make the interpretation process way easier and more efficient. Having critical pieces of data represented with colorful and interactive icons and graphs makes it possible to uncover insights at a glance. For example, the colors green, yellow, and red on the charts for the NPS and the customer effort score allow us to conclude that most respondents are satisfied with this brand with a short glance. A further dive into the line chart below can help us dive deeper into this conclusion, as we can see both metrics developed positively in the past 6 months.
The bottom part of the template provides visually stunning representations of different satisfaction scores for quality, pricing, design, and service. By looking at these, we can conclude that, overall, customers are satisfied with this company in most areas.
2. Brand Analysis Dashboard
Next, in our list of data interpretation examples, we have a template that shows the answers to a survey on awareness for Brand D. The sample size is listed on top to get a perspective of the data, which is represented using interactive charts and graphs.

When interpreting information, context is key to understanding it correctly. For that reason, the dashboard starts by offering insights into the demographics of the surveyed audience. In general, we can see ages and gender are diverse. Therefore, we can conclude these brands are not targeting customers from a specified demographic, an important aspect to put the surveyed answers into perspective.
Looking at the awareness portion, we can see that brand B is the most popular one, with brand D coming second on both questions. This means brand D is not doing wrong, but there is still room for improvement compared to brand B. To see where brand D could improve, the researcher could go into the bottom part of the dashboard and consult the answers for branding themes and celebrity analysis. These are important as they give clear insight into what people and messages the audience associates with brand D. This is an opportunity to exploit these topics in different ways and achieve growth and success.
3. Product Innovation Dashboard
Our third and last dashboard example shows the answers to a survey on product innovation for a technology company. Just like the previous templates, the interactive and visual nature of the dashboard makes it the perfect tool to interpret data efficiently and effectively.

Starting from right to left, we first get a list of the top 5 products by purchase intention. This information lets us understand if the product being evaluated resembles what the audience already intends to purchase. It is a great starting point to see how customers would respond to the new product. This information can be complemented with other key metrics displayed in the dashboard. For example, the usage and purchase intention track how the market would receive the product and if they would purchase it, respectively. Interpreting these values as positive or negative will depend on the company and its expectations regarding the survey.
Complementing these metrics, we have the willingness to pay. Arguably, one of the most important metrics to define pricing strategies. Here, we can see that most respondents think the suggested price is a good value for money. Therefore, we can interpret that the product would sell for that price.
To see more data analysis and interpretation examples for different industries and functions, visit our library of business dashboards .
To Conclude…
As we reach the end of this insightful post about data interpretation and analysis, we hope you have a clear understanding of the topic. We've covered the definition and given some examples and methods to perform a successful interpretation process.
The importance of data interpretation is undeniable. Dashboards not only bridge the information gap between traditional data interpretation methods and technology, but they can help remedy and prevent the major pitfalls of the process. As a digital age solution, they combine the best of the past and the present to allow for informed decision-making with maximum data interpretation ROI.
To start visualizing your insights in a meaningful and actionable way, test our online reporting software for free with our 14-day trial !
The mind-brain relationship and the perspective of meaning
- Mukhopadhyay, Ranjan
We view the mind-body problem in terms of the two interconnected problems of phenomenal consciousness and mental causation, namely, how subjective conscious experience can arise from physical neurological processes and how conscious mental states can causally act upon the physical world. In order to address these problems, I develop here a non-physicalist framework that combines two apparently antithetical views: the materialist view of the mind as a product of the brain and the metaphysical view of consciousness rooted in an underlying hidden reality. I discuss how this framework resolves the problem of mental causation while being simultaneously consistent with fundamental physical principles. I will elucidate how the framework ties in to the perspective of meaning that acts as the bridge between physical neurological processes and the conscious mind. Moreover, we will see how both our awareness of the self and our representation of the external world are connected to this perspective.
- Quantitative Biology - Neurons and Cognition;
- Quantum Physics
IMAGES
VIDEO
COMMENTS
Data Representation in Maths. Definition: After collecting the data, the investigator has to condense them in tabular form to study their salient features.Such an arrangement is known as the presentation of data. Any information gathered may be organised in a frequency distribution table, and then shown using pictographs or bar graphs.
Data representations are useful for interpreting data and identifying trends and relationships. When working with data representations, pay close attention to both the data values and the key words in the question. When matching data to a representation, check that the values are graphed accurately for all categories.
2.1: Types of Data Representation. Page ID. Two common types of graphic displays are bar charts and histograms. Both bar charts and histograms use vertical or horizontal bars to represent the number of data points in each category or interval. The main difference graphically is that in a bar chart there are spaces between the bars and in a ...
In Digital Technologies, data representation means discrete representation of information using number codes. Data may include characters (for example, alphabetic letters, numbers and symbols), images, sounds and/or instructions that, when represented by number codes, can be manipulated, stored and communicated by digital systems.
Learn more about Data Representation. Take a deep dive into Data Representation with our course AI for Designers . In an era where technology is rapidly reshaping the way we interact with the world, understanding the intricacies of AI is not just a skill, but a necessity for designers. The AI for Designers course delves into the heart of this ...
This guide to data representation covers all the key concepts you need to know to understand the principles of representing data in computer systems. Whether you're a GCSE, IB or A-level computer science student, our guide provides a detailed explanation of how data is represented in binary, hexadecimal, and ASCII formats, as well as the ...
By data representation is meant, in general, any convention for the arrangement of things in the physical world in such a way as to enable information to be encoded and later decoded by suitable automatic systems. We specify conventions because information can be conveyed by other means as well.
Data visualization is the graphical representation of information and data. By using v isual elements like charts, graphs, and maps, data visualization tools provide an accessible way to see and understand trends, outliers, and patterns in data. Additionally, it provides an excellent way for employees or business owners to present data to non ...
2. add_item(): This method processes the inventory by adding an item. Again, we're manipulating the data within the GameCharacter object. 3. use_ability(): This method randomly selects an ability from the character's list of abilities and "uses" it. This is another example of data processing.
10+ Best Data Governance Tools (2021) binary number representation data representation diagrammatic and graphical representation of data difference between ascii and unicode graph representation in data structure pictorial representation of data. The computer is incapable of comprehending human language. Any data fed to a computer, such as ...
Data in a computer system is represented in binary format, as a sequence of 0s and 1s, denoting 'off' and 'on' states respectively. The smallest component of this binary representation is known as a bit, which stands for 'binary digit'. A byte, on the other hand, generally encompasses 8 bits.
And so halfway between one and three would be two. So in this case, the median would be two. Now if you had an odd number of numbers, let's say you had one, one, one, three, and four, then you have a very clear middle number here. You order the numbers like this, and then the middle number is this one over here, so that would be the median.
The way that we stored, processed, and transmitted data is referred to as data representation. We can use any device, including computers, smartphones, and iPads, to store data in digital format. The stored data is handled by electronic circuitry. A bit is a 0 or 1 used in digital data representation. Data Representation Techniques.
A computer uses a fixed number of bits to represent a piece of data which could be a number, a character, image, sound, video, etc. Data representation is the method used internally to represent data in a computer. Let us see how various types of data can be represented in computer memory. Before discussing data representation of numbers, let ...
Mantissa, Significand and fraction are synonymously used terms. In the computer, the representation is binary and the binary point is not fixed. For example, a number, say, 23.345 can be written as 2.3345 x 101 or 0.23345 x 10² or 2334.5 x 10-2. The representation 2.3345 x 101 is said to be in normalised form.
A histogram is the graphical representation of data. It is similar to the appearance of a bar graph but there is a lot of difference between histogram and bar graph because a bar graph helps to measure the frequency of categorical data. A categorical data means it is based on two or more categories like gender, months, etc. Whereas histogram is ...
Word embeddings are another approach to text-based data representation that involves representing each word as a vector in a high-dimensional space. Word embeddings are learned by training a neural network on a large corpus of text, and the resulting vectors are designed to capture the semantic meaning of each word (dos Santos et al., 2019 ...
Data Representation • Data refers to the symbols that represent people, events, things, and ideas. Data can be a name, a number, the colors in a photograph, or the notes in a musical composition. • Data Representation refers to the form in which data is stored, processed, and transmitted. • Devices such as smartphones, iPods, and
How data types are structured; for example, how plus and minus signs are represented in numerical values or how character strings are formatted (enclosed in quotes, terminated with a null, etc.).
Graphical representation is a form of visually displaying data through various methods like graphs, diagrams, charts, and plots. It helps in sorting, visualizing, and presenting data in a clear manner through different types of graphs. Statistics mainly use graphical representation to show data.
This information is called static data. static data 0000 stack FFFF • Each time you call a method, Java allocates a new block of memory called a stack frame to hold its local variables. These stack frames come from a region of memory called the stack. • Whenever you create a new object, Java allocates space from a pool of memory called the ...
Dictionary learning is an effective feature learning method, leading to many remarkable results in data representation and classification tasks. However, dictionary learning is performed on the original data representation. In some cases, the capability of representation and discriminability of the learned dictionaries may need to be performed better, i.e., with only sparse but not low rank ...
2. Brand Analysis Dashboard. Next, in our list of data interpretation examples, we have a template that shows the answers to a survey on awareness for Brand D. The sample size is listed on top to get a perspective of the data, which is represented using interactive charts and graphs. **click to enlarge**.
We view the mind-body problem in terms of the two interconnected problems of phenomenal consciousness and mental causation, namely, how subjective conscious experience can arise from physical neurological processes and how conscious mental states can causally act upon the physical world. In order to address these problems, I develop here a non-physicalist framework that combines two apparently ...