
- school Campus Bookshelves
- menu_book Bookshelves
- perm_media Learning Objects
- login Login
- how_to_reg Request Instructor Account
- hub Instructor Commons
- Download Page (PDF)
- Download Full Book (PDF)
- Periodic Table
- Physics Constants
- Scientific Calculator
- Reference & Cite
- Tools expand_more
- Readability
selected template will load here
This action is not available.

Experiment_726_Paper Chromatography_1_2_1
- Last updated
- Save as PDF
- Page ID 305609
Experiment 726: Paper Chromatography: A Technique of Separation and Identification
Section 1: Purpose and Summary
One of the problems encountered most frequently in chemistry is that of separating a mixture into the pure substances which compose it. Most natural materials, such as seawater, air, oil, coal, and so on are mixtures. In order to study these materials chemically, we must first treat the mixture in some way to separate it into single, pure substances. (A "pure substance" consists entirely of just one thing; meaning one kind of molecule.) Because it does consist of just one thing, it always behaves in the same way when tested. For example, pure water always boils at 100°C (212°F), provided that the test is done at atmospheric pressure.
Many different methods have been devised for separating mixtures into their components. In the present experiment, we will use a method called chromatography. It is used quite widely for making small-scale separations and identifications. The method works because of the differences in the ways various components of a dissolved mixture interact with a fixed solid. The fixed solid can be made of different materials and in different shapes, depending on the version of chromatography that is being done. One version is called paper chromatography.
To perform paper chromatography to separate components of a mixture, there are several steps. First, the mixture that is to be separated is dissolved (if it is not already in liquid form.) Then, a small drop of the solution is applied to a piece of special chromatography paper, which is a porous paper similar to filter paper. This drop makes a tiny spot on the paper. Many such spots (of different materials) may be placed side by side on the same piece of paper. Next, the spotted paper is made to stand in a small amount of some special solvent (liquid), in such a way that only the bottom edge of the paper is submerged in the liquid, not the spots. The paper acts like a wick, drawing the liquid up the paper by capillary action. The solvent then slowly rises up the paper, reaches the spots, and begins to dissolve them and carry the substances up the paper with it.
The key to this separation is that the different components of the mixture in each spot interact with the paper differently, and so will be found (after a few minutes) to have reached different heights on the paper. This happens because some components are more strongly attracted to the paper (and so move more slowly), while others are more strongly attracted to the solvent. Any particular substance always moves at the same rate, no matter what else it may have been mixed with originally. For that reason, it can always be recognized and identified, because it will always rise to the same height, relative to the heights that the other components rise.
The movement of any spot on the paper can be quantified by calculating its R f ( retention factor ) value after you have stopped the experiment and the paper has dried.
R f = distance traveled by the solute
distance traveled by the solvent front
The distances used in calculating R f values are measured as shown in the following figure. To determine the distance traveled by the solute , measure from the point at which you originally applied the spot to the center or densest part of the spot. The distance traveled by the solvent front is measured from the original point of application of the spot to the limit of movement of the solvent front (which must be marked immediately after the paper is removed from the beaker, because it may be nearly invisible after the solvent evaporates).
If all conditions could be maintained constant, R f values would be constant. However, either variations in temperature or in the composition of the solvent phase or changes in the paper can alter the R f value. The R f value is useful mainly for expressing the relative mobility of two or more solutes in a particular chromatographic system. The absolute R f values may change from day to day, but their values in relation to each other remain nearly constant.
Figure 1: Completed paper chromatography containing only 1 dye.
In this experiment, students will measure the values of several dyes in 3 different solvent systems. Students will also analyze an unknown mixture of dyes in order to identify the dyes present in the mixture. The three different solvent systems are 1) laboratory water, 2) an aqueous solution of 0.10% sodium chloride (table salt), and 3) rubbing alcohol (70% isopropyl alcohol and 30% water). By using different solvents, the dyes will travel differently in paper chromatography, and the R f values will be different. The goal is to find a solvent that gives a different value for every dye as this will separate all the dyes from each other (scientists say that the dyes are resolved when the solvent system creates distinctly different values for each dye.) When every dye is separated from all the other dyes, then you can match up R f values and identify each dye in the unknown mixture.
Section 2: Safety Precautions and Waste Disposal
Safety Precautions:
Use of eye protection is recommended for all experimental procedures.
The rubbing alcohol used in this lab gives off fumes, so keep the beaker containing this solvent covered with plastic wrap when it is not in the hood.
Waste Disposal:
The rubbing alcohol should be disposed of in the organic waste container in the hood. The aqueous solvents may be poured down the drain. The chromatography paper can be disposed in the trash.
Section 3: Procedure
Preparing and developing the chromatogram
Section 4 : Analysis of the Chromatogra m s
Section 5: Identifying the components in the Unknown Mixture
Post Lab Questions:
Why use a pencil and not a pen to mark your chromatograms?
2) Why is it important that the chromatography paper not touch the sides of the beaker?
3) Which solvent system worked the best for you? Explain.
4) Suppose a student did today’s experiment and obtained the following results:
4a) Which solvent is best for separating Dyes #1-3?
4b) Assume that the student receives an Unknown mixture that contains Component Dye #2 and Component Dye #3. Draw the chromatogram the student would expect to obtain when analyzing Dye #1, Dye #2, Dye #3 and her “Component” mixture when using the best solvent, the same solvent you picked in question 4a. Include the points of application and the solvent front in your drawing.
Notes:
Sciencing_Icons_Science SCIENCE
Sciencing_icons_biology biology, sciencing_icons_cells cells, sciencing_icons_molecular molecular, sciencing_icons_microorganisms microorganisms, sciencing_icons_genetics genetics, sciencing_icons_human body human body, sciencing_icons_ecology ecology, sciencing_icons_chemistry chemistry, sciencing_icons_atomic & molecular structure atomic & molecular structure, sciencing_icons_bonds bonds, sciencing_icons_reactions reactions, sciencing_icons_stoichiometry stoichiometry, sciencing_icons_solutions solutions, sciencing_icons_acids & bases acids & bases, sciencing_icons_thermodynamics thermodynamics, sciencing_icons_organic chemistry organic chemistry, sciencing_icons_physics physics, sciencing_icons_fundamentals-physics fundamentals, sciencing_icons_electronics electronics, sciencing_icons_waves waves, sciencing_icons_energy energy, sciencing_icons_fluid fluid, sciencing_icons_astronomy astronomy, sciencing_icons_geology geology, sciencing_icons_fundamentals-geology fundamentals, sciencing_icons_minerals & rocks minerals & rocks, sciencing_icons_earth scructure earth structure, sciencing_icons_fossils fossils, sciencing_icons_natural disasters natural disasters, sciencing_icons_nature nature, sciencing_icons_ecosystems ecosystems, sciencing_icons_environment environment, sciencing_icons_insects insects, sciencing_icons_plants & mushrooms plants & mushrooms, sciencing_icons_animals animals, sciencing_icons_math math, sciencing_icons_arithmetic arithmetic, sciencing_icons_addition & subtraction addition & subtraction, sciencing_icons_multiplication & division multiplication & division, sciencing_icons_decimals decimals, sciencing_icons_fractions fractions, sciencing_icons_conversions conversions, sciencing_icons_algebra algebra, sciencing_icons_working with units working with units, sciencing_icons_equations & expressions equations & expressions, sciencing_icons_ratios & proportions ratios & proportions, sciencing_icons_inequalities inequalities, sciencing_icons_exponents & logarithms exponents & logarithms, sciencing_icons_factorization factorization, sciencing_icons_functions functions, sciencing_icons_linear equations linear equations, sciencing_icons_graphs graphs, sciencing_icons_quadratics quadratics, sciencing_icons_polynomials polynomials, sciencing_icons_geometry geometry, sciencing_icons_fundamentals-geometry fundamentals, sciencing_icons_cartesian cartesian, sciencing_icons_circles circles, sciencing_icons_solids solids, sciencing_icons_trigonometry trigonometry, sciencing_icons_probability-statistics probability & statistics, sciencing_icons_mean-median-mode mean/median/mode, sciencing_icons_independent-dependent variables independent/dependent variables, sciencing_icons_deviation deviation, sciencing_icons_correlation correlation, sciencing_icons_sampling sampling, sciencing_icons_distributions distributions, sciencing_icons_probability probability, sciencing_icons_calculus calculus, sciencing_icons_differentiation-integration differentiation/integration, sciencing_icons_application application, sciencing_icons_projects projects, sciencing_icons_news news.
- Share Tweet Email Print
- Home ⋅
- Science Fair Project Ideas for Kids, Middle & High School Students ⋅
Paper Chromatography Science Projects With a Hypothesis

Chemicals in Dry-Erase Markers
Paper chromatography analyzes mixtures by separating the chemical contents onto paper. For instance, chromatography is used in forensic science to separate chemical substances such as drugs in urine and blood samples. Students can perform paper chromatography projects using ink to understand how scientists are able to determine the presence of different chemicals.
Separate Ink Colors
Form an experiment to separate ink colors using paper chromatography. Hypothesize that regular black ink will show colors on the paper chromatography more noticeably than permanent ink. Set up the experiment using coffee filters and washable and permanent markers. Cut the coffee filters into long strips for each pen. Form a loop by stapling the ends of the strips together. Place a dot of ink on the bottoms of the coffee filter strips. Label each strip using a pencil, specifying the type of pen. Place the strips into a glass, then add water until it touches the bottom of the paper. Observe the strip. Compare your results between permanent marker and washable marker ink. The washable marker colors should spread out onto the paper, while the permanent marker does not because of its permanent ink.
Water vs. Rubbing Alcohol
Create an experiment to separate permanent marker ink colors using paper chromatography in water and rubbing alcohol. Hypothesize that rubbing alcohol will separate the ink colors in permanent markers, while water will not. Set up the experiment using coffee filters and permanent markers. Cut the coffee filters into long strips for each pen. Form a loop by stapling the ends of each strip together. Place a dot of ink on the bottom of the coffee filter strips. Place one strip into a glass of water and place another strip into a glass of rubbing alcohol until the fluid touches the bottom of the paper. Observe the strips. Compare your results between the water and rubbing alcohol solution. The colors should separate on the strip dipped in the rubbing alcohol, but won’t separate when using water.
Different Solvents
Conduct a paper chromatography project to find out if different types of solvents separate ink differently. Set up the experiment using coffee filters and permanent markers. Cut the coffee filters into long strips. Form a loop by stapling the ends of each strip together. Place a dot of ink on the bottom of the coffee filter strips. Place a strip each into a glass of water, rubbing alcohol, vinegar and nail polish remover. Make sure to only add liquid to touch the bottom of the strip. Observe the strips and compare results. Indicate which solvent separated the ink colors the best.
Use a Black Light
Perform an ink paper chromatography test and use a black light to determine if there are any more components visible on the paper than in regular light. Hypothesize that more components will be seen under black light, because some chemicals are invisible under white light. Make sure to look at the paper the same day the paper chromatography test was conducted in order to assure there is no fading on the paper.
Related Articles
How to separate the components of ink, how can parts of a solution be separated by chromatography, why does chromatography work, methods on how to determine ph in ph paper, cool science experiments for teens, what is contained in a permanent marker, how does paper chromatography work & why do pigments..., 5th grade solubility experiment, how-to science experiments for kids with iodine and..., what color would a tester ph paper turn if is dipped..., chalk and vinegar science projects, how to make disappearing ink reappear, how to use litmus papers, what turns ph paper green, food coloring & science projects, food coloring experiments, science fair projects & ideas on art, what is the difference between a solution and a suspension, how to test for hydrochloric acid.
- Science Buddies; Paper Chromatography: Basic Version; Amber Hess; April 2008
About the Author
Based in Huntington Beach, Calif., Dana Schafer has been writing environmental articles and grant proposals since 2006. Schafer has written for Grace Unlimited Corporation and Youth Have Vision. Schafer is in the process of receiving a Master of Science in biology from California State University, Long Beach.
Photo Credits
Comstock/Comstock/Getty Images
Find Your Next Great Science Fair Project! GO
We Have More Great Sciencing Articles!
Paper Chromatography of Plant Pigments
Learning Objectives
After completing the lab, the student will be able to:
- Extract pigments from plant material.
- Separate pigments by paper chromatography.
- Measure R f (retention factor) values for pigments.
Activity 2: Pre-Assessment
- The leaves of some plants change color in fall. Green foliage appears to turn to hues of yellow and brown. Does the yellow color appear because carotenoids replace the green chlorophylls? Explain your reasoning.
- Examine the molecular structures of photosynthetic pigments in Figure 10.1. Photosynthetic pigments are hydrophobic molecules located in thylakoid membranes. Will these pigments dissolve in water?
Activity 2: Paper Chromatography of Plant Pigments
Paper chromatography is an analytical method that separates compounds based on their solubility in a solvent.
The solvent is used to separate a mixture of molecules that have been applied to filter paper. The paper, made of cellulose, represents the stationary or immobile phase. The separation mixture moves up the paper by capillary action. It is called the mobile phase. The results of chromatography are recorded in a chromatogram. Here, the chromatogram is the piece of filter paper with the separated pigment that you will examine at the end of your experiment (see Figure 10.4).
We separate the compounds based on how quickly they move across the paper. Compounds that are soluble in the solvent mixture will be more concentrated in the mobile phase and move faster up the paper. Polar compounds will bind to the cellulose in the paper and trail behind the solvent front. As a result, the different compounds will separate according to their solubility in the mixture of organic solvents we use for chromatography.
This video demonstrates the principles and examples of chromatography. You will experiment with only paper chromatography in this lab; however, you will see that you are already familiar with some uses of thin layer chromatography.
Safety Precautions
- Work under a hood or in a well-ventilated space and avoid breathing solvents.
- Do not have any open flames when working with flammable solvents.
- Wear aprons and eye protection.
- Do not pour any organic solvent down the drain.
- Dispose of solvents per local regulations.
- Use forceps to handle chromatography paper that has been immersed in solvent and wash your hands after completing this activity.
For this activity, you will need the following:
- Plant material: intact leaves of spinach and Coleus (one leaf of each plant per pair of students)
- Filter or chromatography paper
- Ruler (one per group)
- Colored pencils
- Beakers (400 mL) (Mason jars are an acceptable substitute)
- Aluminum foil
- Petroleum ether: acetone: water in a 3:1:1 proportion
- If no hood or well-ventilated place is available, the mixture can be substituted with 95 percent isopropyl alcohol. Note that, if isopropyl alcohol is used, the pigment bands will smear. You may not be able to separate and identify the chlorophylls or carotene from xanthophyll.
For this activity, you will work in pairs .
Structured Inquiry
Step 1: Hypothesize/Predict: Discuss with your lab partner what color pigments will likely be present in the spinach leaves. Write your predictions in your lab notebook and draw a diagram of how you think the pigments will separate out on the chromatography paper.
Step 2: Student-led Planning: Read step 3 below. Discuss with your lab partner the setup of the experiment. Then agree upon the dimensions of the filter/chromatography paper that you will use. To allow good separation, the paper should not touch the walls of the container. The paper must fit inside the container while being long enough for maximum separation. Write all your calculations in your lab notebook.
Step 3: Follow the steps below to set up your filter paper and perform the chromatography experiment.
- Prepare the chromatogram by cutting a piece of filter paper. Transfer pigments from spinach leaves as in Activity 1. A heavy application line will yield stronger colors when the pigments separate, making it easier to read results. Allow the pigments to dry between applications. Wet extracts diffuse on the paper and yield blurry lines.
- Form a cylinder with the filter paper without overlapping the edges (to avoid edge effects). The sample should face the outside of the cylinder. Secure the top and bottom of the cylinder with staples.
- Pour enough separation mixture to provide a mobile phase while staying below the origin line on the chromatogram. The exact volume is not critical if the origin, the start line where you applied the solvent, is above the solvent. See Figure 10.4.

- Label the beaker with a piece of tape with your initials and your partner’s initials.
- Lower the paper into the container with the band from the extraction in the lower section. The paper must touch the solvent, but not reach the band of pigment you applied. Why must the band be above the solvent line? Write your answer in your notebook.
- Cover the container tightly with a piece of aluminum foil.
- Track the rising of the solvent front. Can you see a separation of colors on the paper?
- When the solvent front is within 1 cm of the upper edge of the paper, remove the cylinder from the beaker using forceps. Trace the solvent front with a pencil before it evaporates and disappears! Draw the colored bands seen on your chromatography paper in your lab notebook immediately. The colors will fade upon drying. If no colored pencils are available, record the colors of the lines.
- Let the paper dry in a well-ventilated area before making measurements because the wet paper is fragile and may break when handled. This is also a precaution to avoid breathing fumes from the chromatogram.
- Discard solvent mixture per your instructor’s directions. Do not pour down the drain.
Step 4: Critical Analysis: Open the dried cylinder by removing the staples. Measure the distance from the first pencil line to the solvent front, as shown in Figure 10.5. This is the distance traveled by the solvent front. Measure the distance from the pencil line to the middle point of each color band and the original pencil line. Record your results in your notebook in a table modeled after Table 10.1. The retention factor (R f ) is the ratio of the distance traveled by a colored band to the distance traveled by the solvent front. Calculate R f values for each pigment using the following equation:
R f=Distance traveled by colored band/Distance traveled by solvent front

Step 5: After determining the color of the band, tentatively identify each band. Did your results support your hypothesis about the color of each band? Discuss which aspects of the experiments may have yielded inconclusive results. How could you improve the experiment?
Guided Inquiry
Step 1: Hypothesize/Predict: What type of pigments are present in Coleus leaves and where are the different colors located? Can you make a hypothesis based on the coloration of the variegated leaves? Write your hypothesis down in your lab notebook. Would there be a difference if you performed chromatography on pigment composition from different colored regions of the leaves?
Step 2: Student-led Planning: Cut the chromatography/filter paper to the dimensions needed. Apply pigments from different parts of the Coleus leaves following the procedure described under Activity 1, keeping in mind that a darker line will yield stronger colors when the pigments are separated, which will make it easier to read the results. Allow the pigments to dry between applications. Wet extracts diffuse on the paper and yield blurry lines.
Step 3: When the solvent front reaches 1 cm from the top of the filter paper, stop the procedure. Draw the pigment bands you see on the filter paper in your lab notebook. Clearly indicate the color you observed for each band.
Step 4: Let the cylinder dry and measure the distance the front traveled from the origin and the distances traveled by each of the pigments. If the bands broadened during separation, take measurements to the middle of each band.
Step 5: Critical Analysis: Calculate R f for each of the bands and record them in a table in your notebook. Compare the R f you obtained with those of other groups. Are the R f values similar? What may have altered R f values?
Assessments
- Carotenoids and chlorophylls are hydrophobic molecules that dissolve in organic solvents. Where would you find these molecules in the cell? What would happen if you ran the chromatography in this lab with water as the solvent?
- All chlorophyll molecules contain a complexed magnesium ion. Your houseplant is developing yellow leaves. What may cause this, and how can you restore your plant’s health?
- Seeds that grow under dim light are said to be etiolated, which describes their pale and spindly appearance. They soon waste away after exhausting their food reserves. Can you explain this observation?
Lab Manual for Biology Part I Copyright © 2022 by LOUIS: The Louisiana Library Network is licensed under a Creative Commons Attribution-NonCommercial-ShareAlike 4.0 International License , except where otherwise noted.
Share This Book
BIOLOGY JUNCTION
Test And Quizzes for Biology, Pre-AP, Or AP Biology For Teachers And Students
Paper Chromatography Report
Introduction The purpose of this experiment is to observe how chromatography can be used to separate mixtures of chemical substances. Chromatography serves mainly as a tool for the examination and separation of mixtures of chemical substances. Chromatography is using a flow of solvent or gas to cause the components of a mixture to migrate differently from a narrow starting point in a specific medium, in the case of this experiment, filter paper. It is used for the purification and isolation of various substances. A chromatographically pure substance is the result of the separation. Because purification of substances is required to determine their properties, chromatography is an indispensable tool in the sciences concerned with chemical substances and their reactions.
Chromatography is also used to compare and describe chemical substances. The chromatographic sequence of sorbed substances is related to their atomic and molecular structures. A change in a chemical substance produced by a chemical or biological reaction often alters the solubility and migration rate. With this knowledge, alterations or changes can be detected in the substance.
In all chromatographic separations, there is an important relationship between the solvent, the chromatography paper, and the mixture. For a particular mixture, the solvent and the paper must be chosen so the solubility is reversible and be selective for the components of the mixture. The main requirement, though, of the solvent is to dissolve the mixture needing to be separated. The porous paper used must also absorb the components of the mixtures selectively and reversibly. For the separation of a mixture, the substances making up the mixture must be evenly dispersed in a solution, a vapor, or a gas. Once all of the above criteria have been met, chromatography can be a simple tool for separating and comparing chemical mixtures.
Hypothesis Paper can be used to separate mixed chemicals.
Materials The materials used for this lab are paper, pencil, eraser, filter paper, test tube, rubber stopper, paper clip, metric ruler, black felt-tip pen, and a computer.
Methods The first step of the method is to bend a paper clip so that it is straight with a hook at one end. Push the straight end of the paper clip into the bottom of the rubber stopper. Next, you hang a thin strip of filter paper on the hooked end of the paper clip. Insert the paper strip into the test tube. The paper should not touch the sides of the test tube and should almost touch the bottom of the test tube. Now you will remove the paper strip from the test tube. Draw a solid 5-mm-wide band about 25 mm from the bottom of the paper, using the black felt-tip pen. Use a pencil to draw a line across the paper strip 10 cm above the black band.
Pour about 2 mL of water into the test tube. The water will act as a solvent. Put the filter paper back into the test tube with the bottom of the paper in the water and the black band above the water. Observe what happens as the liquid travels up the paper. Record the changes you see. When the solvent has reached the pencil line, remove the paper from the test tube. Measure how far the solvent traveled before the strip dries. Finally, let the strip dry on the desk. With the metric ruler, measure the distance from the starting point to the top edge of each color. Record this data in a data table. Calculate a ratio for each color by dividing the distance the color traveled by the distance the solvent traveled.
Results The results of the experiment are shown in a chart and a graph.
1. How many colors separated from the black ink? Five colors separated from the black ink: yellow, pink, red, purple, and blue.
2. What served as the solvent for the ink? Water served as the solvent for the ink. As the solvent traveled up the paper, which color of ink appeared first? The color orange first appeared as the solvent traveled up the paper.
3. List the colors in order, from top to bottom, which separated from the black ink. The colors separated in this order, from top to bottom: blue, purple, red, pink, and then yellow.
4. In millimeters, how far did the solvent travel? The solvent traveled 111 mm.
5. From your results, what can you conclude is true about black ink? Black ink is a mixture of several different colors.
6 . Why did the inks separate? The inks separated because the black ink was a mixture of different pigments with different molecular characteristics. These differences allow for different rates of absorption by the filter paper.
7. Why did some inks move a greater distance? The ink least readily absorbed by the paper would then travel the farthest from the starting mark. You can conclude from this information that the different pigments were absorbed at different rates.
Error Analysis Possible errors could include inaccurate measurements of the distances traveled by the inks and mistakes when calculating the ratio traveled by the water and colors. If a longer test tube was used, a longer strip of filter paper could have been used. This may have changed the ratios. Another color may have been present, but not detected because of the filter paper length.
Conclusion The proposed hypothesis was correct. The paper chromatography did show that black ink could be separated into various colors. The black ink gets its color from a mixture of various colored inks blended together. The first color of ink to appear on the filter paper was yellow followed by pink, red, purple then blue. The colors separated the way they did because of the differences in their molecular characteristics, specifically, their solubility in water and their rate of absorption by the paper. The most soluble and readily absorbed ink color was the yellow. The least soluble and least absorbable ink color was the blue.
- Skip to primary navigation
- Skip to main content
- Skip to primary sidebar

- FREE Experiments
- Kitchen Science
- Climate Change
- Egg Experiments
- Fairy Tale Science
- Edible Science
- Human Health
- Inspirational Women
- Forces and Motion
- Science Fair Projects
- STEM Challenges
- Science Sparks Books
- Contact Science Sparks
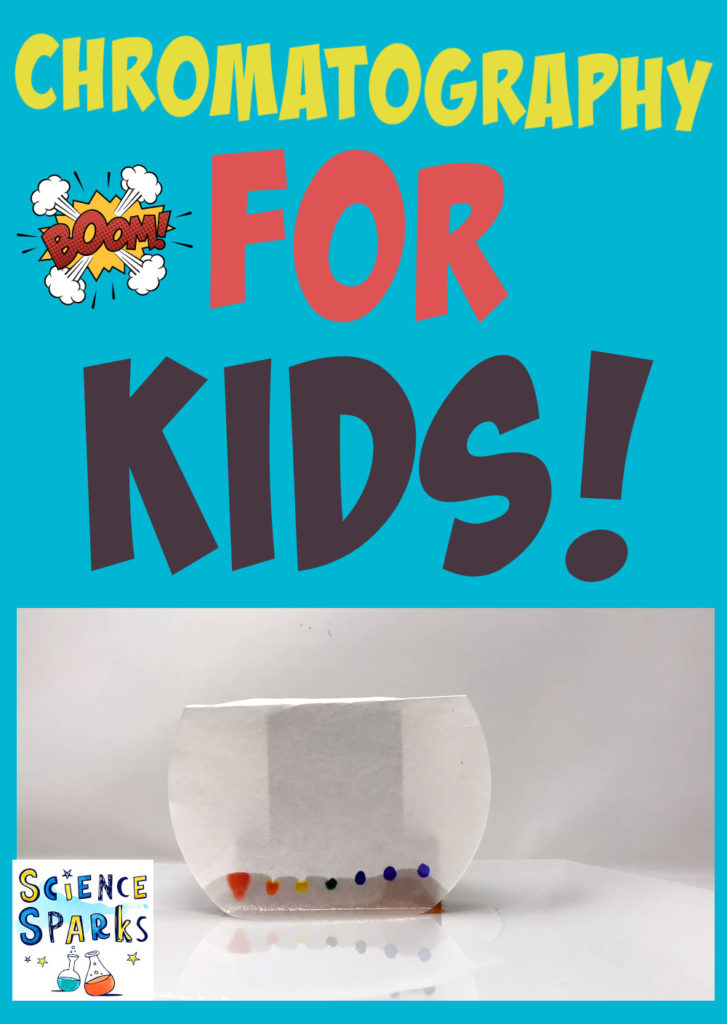
Paper Chromatography Experiment
March 17, 2021 By Emma Vanstone Leave a Comment
This simple paper chromatography experiment is a great way to learn about this particular method of separating mixtures .
WHAT IS CHROMATOGRAPHY?
Chromatography is a technique used to separate mixtures. Information from a chromatography investigation can also be used to identify different substances.
In chromatography, the mixture is passed through another substance, in this case, filter paper. The different colour ink particles travel at different speeds through the filter paper allowing you to see the constituent colours of the pen ink.
All types of chromatography have two phases. A mobile phase where the molecules can move and a stationary phase where the molecules can’t move. In the case of paper chromatography, the stationary phase is the filer paper, and the mobile phase is the solvent ( water ).
The more soluble the ink molecules, the further they are carried up the paper.
The video below shows chromatography in action.
You’ll need:
Filter paper or paper towel
Felt tip pens – not washable or permanent
A container – glass, jar or plate

Instructions
Pour a small amount of water onto a plate or into the bottom of a jar.
Find a way to suspend the filter paper over the water so just the very bottom is touching the water. If you do the experiment in a jar, the easiest way to do this is to wrap the top of the filter paper around a pencil, clip it in place and suspend it over the top of the jar.
Our LEGO holder worked well too!

Use the felt tip pens to draw a small circle about 1cm from the bottom of the filter paper with each colour pen you want to test.
Suspend the filter paper in the water and watch as the ink moves up the filter paper.
You should end up with something like this! We call the finished filter paper, a chromatogram.

What happens if you use washable pens?
If the inks are washable, they tend just to contain one type of ink, and so you don’t see any separation of colour.
You can see below that only a couple of the inks have separated out, compared to the non-washable pens above.

Why does chromatography work?
When the filter paper containing the ink spots is placed in the solvent ( in this case, water ), the dyes travel through the paper.
Different dyes in ink travel through the chromatography filter paper at different speeds. The most soluble colours dissolve and travel further and faster than less soluble dyes, which stick to the paper more.
Extension task
Experiment with different types and colours of pens. Depending on the type of ink used, some will work better than others.
Try chromatography with sweets .
Steamstational also has a great leaf chromatography investigation.
More separation experiments
Clean up water by making your own filter .

Separate water and sand by evaporation .
Make colourful salt crystals by separating salt and water.
Separate liquid mixtures with a bicycle centrifuge .
Last Updated on August 10, 2023 by Emma Vanstone
Safety Notice
Science Sparks ( Wild Sparks Enterprises Ltd ) are not liable for the actions of activity of any person who uses the information in this resource or in any of the suggested further resources. Science Sparks assume no liability with regard to injuries or damage to property that may occur as a result of using the information and carrying out the practical activities contained in this resource or in any of the suggested further resources.
These activities are designed to be carried out by children working with a parent, guardian or other appropriate adult. The adult involved is fully responsible for ensuring that the activities are carried out safely.
Your browser is not supported
Sorry but it looks as if your browser is out of date. To get the best experience using our site we recommend that you upgrade or switch browsers.
Find a solution
- Skip to main content
- Skip to navigation
- Back to parent navigation item
- Primary teacher
- Secondary/FE teacher
- Early career or student teacher
- Higher education
- Curriculum support
- Literacy in science teaching
- Periodic table
- Interactive periodic table
- Climate change and sustainability
- Resources shop
- Collections
- Post-lockdown teaching support
- Remote teaching support
- Starters for ten
- Screen experiments
- Assessment for learning
- Microscale chemistry
- Faces of chemistry
- Classic chemistry experiments
- Nuffield practical collection
- Anecdotes for chemistry teachers
- On this day in chemistry
- Global experiments
- PhET interactive simulations
- Chemistry vignettes
- Context and problem based learning
- Journal of the month
- Chemistry and art
- Art analysis
- Pigments and colours
- Ancient art: today's technology
- Psychology and art theory
- Art and archaeology
- Artists as chemists
- The physics of restoration and conservation
- Ancient Egyptian art
- Ancient Greek art
- Ancient Roman art
- Classic chemistry demonstrations
- In search of solutions
- In search of more solutions
- Creative problem-solving in chemistry
- Solar spark
- Chemistry for non-specialists
- Health and safety in higher education
- Analytical chemistry introductions
- Exhibition chemistry
- Introductory maths for higher education
- Commercial skills for chemists
- Kitchen chemistry
- Journals how to guides
- Chemistry in health
- Chemistry in sport
- Chemistry in your cupboard
- Chocolate chemistry
- Adnoddau addysgu cemeg Cymraeg
- The chemistry of fireworks
- Festive chemistry
- Education in Chemistry
- Teach Chemistry
- On-demand online
- Live online
- Selected PD articles
- PD for primary teachers
- PD for secondary teachers
- What we offer
- Chartered Science Teacher (CSciTeach)
- Teacher mentoring
- UK Chemistry Olympiad
- Who can enter?
- How does it work?
- Resources and past papers
- Top of the Bench
- Schools' Analyst
- Regional support
- Education coordinators
- RSC Yusuf Hamied Inspirational Science Programme
- RSC Education News
- Supporting teacher training
- Interest groups

- More from navigation items
Leaf chromatography
In association with Nuffield Foundation
- Five out of five
- No comments
Try this class practical using paper chromatography to separate and investigate the pigments in a leaf
Most leaves are green due to chlorophyll. This substance is important in photosynthesis (the process by which plants make their food). In this experiment, students investigate the different pigments present in a leaf, from chlorophyll to carotenes, using paper chromatography.
The experiment takes about 30 minutes and can be carried out in groups of two or three students.
- Eye protection
- Pestle and mortar
- Chromatography paper
- Beaker, 100 cm 3
- Small capillary tube (see note 1)
- Cut-up leaves, or leaves and scissors (see note 2)
- Propanone (HIGHLY FLAMMABLE, IRRITANT), supplied in a small bottle fitted with a teat pipette (see note 3)
Equipment notes
- The capillary tubing can be ‘home-made’ from lengths of ordinary glass tubing (diameter: 3–4 mm) using a Bunsen burner fitted with a flame-spreading (‘fish-tail’) jet.
- A variety of leaves can be used. Best results are obtained from trees or bushes with dark green leaves, eg holly.
- Preferably use teat pipettes that do not allow squirting, eg those fitted to dropper bottles of universal indicator.
Health, safety and technical notes
- Read our standard health and safety guidance.
- Wear eye protection throughout.
- Propanone, CH 3 COCH 3 (l), (HIGHLY FLAMMABLE, IRRITANT) – see CLEAPSS Hazcard HC085A . The vapour of propanone is HIGHLY FLAMMABLE. Do not have any source of ignition nearby.
- Finely cut up some leaves and fill a mortar to about 2 cm depth.
- Add a pinch of sand and about six drops of propanone from the teat pipette.
- Grind the mixture with a pestle for at least three minutes.
- On a strip of chromatography paper, draw a pencil line 3 cm from the bottom.
- Use a fine glass tube to put liquid from the leaf extract onto the centre of the line. Keep the spot as small as possible.
- Allow the spot to dry, then add another spot on top. Add five more drops of solution, letting each one dry before putting on the next. The idea is to build up a very concentrated small spot on the paper.
- Attach the paper to the pencil using sellotape so that when placed in the beaker, the paper is just clear of its base.
- Place no more than about 10 cm 3 of propanone in the beaker and hang the paper so it dips in the propanone. Ensure the propanone level is below the spot.

Source: Royal Society of Chemistry
The equipment required for using paper chromatography to separate the different pigments in leaves
- Avoid moving the beaker in any way once the chromatography has started.
- Leave the experiment until the propanone has soaked near to the top, and then remove the paper from the beaker.
- Mark how high the propanone gets on the paper with a pencil and let the chromatogram dry.
Teaching notes
This experiment works very well providing care is taken over preparing the spot on the chromatography paper. It should be as small and as concentrated as possible. Encourage students to be patient and to wait until each application is dry before adding the next.
At least three spots should be obtained, and one of these should be yellow due to carotenes.
The extent to which any particular component moves up the paper is dependent not only on its solubility in propanone but also on its attraction for the cellulose in the chromatography paper. The yellow carotene spot (with a higher RF value) tends to move up the paper the furthest.
Additional information
This is a resource from the Practical Chemistry project , developed by the Nuffield Foundation and the Royal Society of Chemistry.
Practical Chemistry activities accompany Practical Physics and Practical Biology .
© Nuffield Foundation and the Royal Society of Chemistry
- 11-14 years
- 14-16 years
- Practical experiments
- Chromatography
Specification
- 2. Develop and use models to describe the nature of matter; demonstrate how they provide a simple way to to account for the conservation of mass, changes of state, physical change, chemical change, mixtures, and their separation.
- Chromatography as a separation technique in which a mobile phase carrying a mixture is caused to move in contact with a selectively absorbent stationary phase.
- 6 Investigate how paper chromatography can be used to separate and tell the difference between coloured substances. Students should calculate Rf values.
- Chromatography involves a stationary phase and a mobile phase. Separation depends on the distribution of substances between the phases.
- The ratio of the distance moved by a compound (centre of spot from origin) to the distance moved by the solvent can be expressed as its Rf value: Rf = (distance moved by substance / distance moved by solvent)
- Mixtures can be separated by physical processes such as filtration, crystallisation, simple distillation, fractional distillation and chromatography. These physical processes do not involve chemical reactions and no new substances are made.
- Recall that chromatography involves a stationary and a mobile phase and that separation depends on the distribution between the phases.
- Interpret chromatograms, including measuring Rf values.
- Suggest chromatographic methods for distinguishing pure from impure substances.
- 12 Investigate how paper chromatography can be used to separate and tell the difference between coloured substances. Students should calculate Rf values.
- 2.11 Investigate the composition of inks using simple distillation and paper chromatography
- 2.9 Describe paper chromatography as the separation of mixtures of soluble substances by running a solvent (mobile phase) through the mixture on the paper (the paper contains the stationary phase), which causes the substances to move at different rates…
- C2.1g describe the techniques of paper and thin layer chromatography
- 2.9 Describe paper chromatography as the separation of mixtures of soluble substances by running a solvent (mobile phase) through the mixture on the paper (the paper contains the stationary phase), which causes the substances to move at different rates o…
- C5.1.4 recall that chromatography involves a stationary and a mobile phase and that separation depends on the distribution between the phases
- 3 Using chromatography to identify mixtures of dyes in a sample of an unknown composition
- C3 Using chromatography to identify mixtures of dyes in a sample of an unknown composition
- 1.9.5 investigate practically how mixtures can be separated using filtration, crystallisation, paper chromatography, simple distillation or fractional distillation (including using fractional distillation in the laboratory to separate miscible liquids…
- 1.9.7 interpret a paper chromatogram including calculating Rf values;
- carry out paper and thin-layer chromatography and measure the Rf values of the components and interpret the chromatograms;
Related articles

How to teach chromatography at post-16
2024-03-11T04:00:00Z By Andy Markwick
Everything you need to help your students master the fundamentals of this analytical technique

Chromatography challenge | 16–18 years
By Andy Markwick
Explore analytical techniques and their applications with a chromatography investigation and research activity

Crime-busting chemical analysis
2024-02-26T05:00:00Z By Kit Chapman
From dog detectives to AI, discover the cutting-edge advances in forensic science
No comments yet
Only registered users can comment on this article., more from experiments.

‘Gold’ coins on a microscale | 14–16 years
By Dorothy Warren and Sandrine Bouchelkia
Practical experiment where learners produce ‘gold’ coins by electroplating a copper coin with zinc, includes follow-up worksheet

Practical potions microscale | 11–14 years
By Kirsty Patterson
Observe chemical changes in this microscale experiment with a spooky twist.

Antibacterial properties of the halogens | 14–18 years
By Kristy Turner
Use this practical to investigate how solutions of the halogens inhibit the growth of bacteria and which is most effective
- Contributors
- Email alerts
Site powered by Webvision Cloud
Variation of the Technical Parameters of Steam-Activated Carbons Based on Peat and Polyurethane-Polyamide Fiber Waste
- Sorption and Ion-Exchange Processes
- Published: November 2005
- Volume 78 , pages 1816–1820, ( 2005 )
Cite this article
- A. N. Khomutov 1 , 2 ,
- V. N. Klushin 1 , 2 &
- V. M. Mukhin 1 , 2
39 Accesses
2 Citations
Explore all metrics
The wear resistance, porosity, and ion-exchange properties of steam-activated cokes in the form of cylindrical granules, obtained from Dorlastan polyurethane-polyamide fiber waste and cotton grass-sphagnum peat under conditions of purely kinetic control were studied at the combustion loss increased to 50%.
This is a preview of subscription content, log in via an institution to check access.
Access this article
Price includes VAT (Russian Federation)
Instant access to the full article PDF.
Rent this article via DeepDyve
Institutional subscriptions
Kolyshkin, D.A. and Mikhailova, K.K., Aktivnye ugli: svoistva i metody ispytanii: spravochnik (Activated Carbons: Properties and Testing Methods: Reference Book), 1972.
Voiloshnikov, V.I., Sorption Recovery of Noble Metals from Cyanide Solutions and Pulps, Cand. Sci. Dissertation , Irkutsk, 1989.
RF Patent Appl. 94 020 452/26.
Mukhin, V.M., Zimin, N.A., Zubova, I.D., and Labun', A.N., Abstracts of Papers, IX Mezhdunarodnaya konferentsiya po teoreticheskim voprosam adsorbtsii i adsorbtsionnoi khromatografii “Sovremennoe sostoyanie i perspektivy razvitiya teorii adsorbtsii”, k 100-letiyu so dnya rozhdeniya akad. M.M. Dubinina (Int. Conf. on Theoretical Problems of Adsorption and Adsorption Chromatography “Current State and Prospects for Development of the Theory of Adsorption”, Dedicated to the Centennial of Acad. M.M. Dubinin), Moscow, April, 24–28, 2001, Moscow: Inst. Fiz. Khim. Ross. Akad. Nauk, 2001, p. 67.
Google Scholar
Nikolaev, V.G. and Strelko, V.V., Gemosorbtsiya na aktivnykh uglyakh (Hemosorption on Activated Carbons), Kiev: Naukova Dumka, 1979.
Dudarev, V.I., Carbon Adsorbents for Metal Recovery from Solutions and Pulps, Doctoral Dissertation , Moscow, 2001.
Pokonova, Yu.V., Khim. Tverd. Topl. , 2001, no. 2, pp. 24–34.
Khomutov, A.N., Klushin, V.N., and Mukhin, V.M., Sb. Nauchn. Tr. Ross. Khim.-Tekhnol. Univ. im D.I. Mendeleeva: Usp. Khim. Khim. Tekhnol. , 2004, vol. 18, no.6 (46), part 1, pp. 94–95.
Tarasevich, M.R., Elektrokhimiya uglerodnykh materialov (Electrochemistry of Carbon Materials), Moscow: Nauka, 1984.
Golub, D., Soffer, A., and Oren, Y., J. Electroanal. Chem. , 1989, vol. 260, pp. 383–392.
Article CAS Google Scholar
Tarkovskaya, I.A., Okislennyi ugol' (Oxidized Carbon), Kiev: Naukova Dumka, 1981.
Boehm, H.P., Adv. Catal. Relat. Subj. , 1966, vol. 16, pp. 179–274.
CAS Google Scholar
Glushchenko, V.Yu., Adsorbtsiya i poristost': Trudy Chetvertoi vsesoyuznoi konferentsii po teoreticheskim voprosam adsorbtsii (Adsorption and Porosity: Proc. Fourth All-Union Conf. on Theoretical Problems of Adsorption), Moscow: Nauka, 1976, pp. 35–40.
Gunasingham, H. and Fleet, B., Analyst , 1982, vol. 107, pp. 896–902.
Mukhin, V.M., Klushin, V.N., and Tarasov, A.V., Aktivnye ugli Rossii (Activated Carbons of Russia), Moscow: Metallurgiya, 2000.
Gur'yanov, V.V., Polyakov, N.N., and Petukhova, G.A., Izv. Ross. Akad. Nauk, Ser. Khim. , 2001, no. 6, pp. 933–937.
Besedina, I.N., Simkin, Yu.Ya., and Petrov, V.S., Khim. Rast. Syr'ya , 2001, no. 2, pp. 71–74.
Honyak, V.P., Mazina, O.I., and Drozhalina, N.D., Khim. Tverd. Topl. , 1990, no. 3, pp. 74–77.
Drozhalina, N.D., Uglerodnye molekulyarnye sita na osnove torfa (Peat-Based Carbon Molecular Sieves), Minsk: Nauka i Tekhnika, 1984.
Khomutov, A.N., Klushin, V.N., and Mukhin, V.M., Sb. Nauchn. Tr. Ross. Khim.-Tekhnol. Univ. im D.I. Mendeleeva: Usp. Khim. Khim. Tekhnol. , 2004, vol. 18, no.6 (46), part 2, pp. 95–97.
Cheremskoi, G.P., Metody issledovaniya poristosti tverdykh tel (Methods of Studying the Porosity of Solids), Moscow: Energoizdat, 1985.
Polyanskii, N.G., Gorbunov. G.V., and Polyanskaya N.L., Metody issledovaniya ionitov (Methods of Studying Ion Exchangers), Moscow: Khimiya, 1976, pp. 159–163.
Velikii, E.M. and Alifanova, N.N., Aktual'nye problemy adsorbtsionnykh protsessov: Materialy 4 Vserossiiskogo simpoziuma (Urgent Problems of Adsorption Processes: Proc. 4th All-Russia Symp.), Moscow, 1997 (publ. 1998), p. 145.
Download references
Author information
Authors and affiliations.
Mendeleev Russian University of Chemical Engineering, Moscow, Russia
A. N. Khomutov, V. N. Klushin & V. M. Mukhin
Neorganika Research and Production Association, State Unitary Enterprise, Elektrostal, Moscow oblast, Russia
You can also search for this author in PubMed Google Scholar
Additional information
Translated from Zhurnal Prikladnoi Khimii, Vol. 78, No. 11, 2005, pp. 1848–1852.
Original Russian Text Copyright © 2005 by Khomutov, Klushin, Mukhin.
Rights and permissions
Reprints and permissions
About this article
Khomutov, A.N., Klushin, V.N. & Mukhin, V.M. Variation of the Technical Parameters of Steam-Activated Carbons Based on Peat and Polyurethane-Polyamide Fiber Waste. Russ J Appl Chem 78 , 1816–1820 (2005). https://doi.org/10.1007/s11167-005-0613-4
Download citation
Received : 25 November 2004
Accepted : 15 July 2005
Issue Date : November 2005
DOI : https://doi.org/10.1007/s11167-005-0613-4
Share this article
Anyone you share the following link with will be able to read this content:
Sorry, a shareable link is not currently available for this article.
Provided by the Springer Nature SharedIt content-sharing initiative
- Wear Resistance
- Technical Parameter
- Kinetic Control
- Find a journal
- Publish with us
- Track your research
IMAGES
VIDEO
COMMENTS
Figure 1: Completed paper chromatography containing only 1 dye. In this experiment, students will measure the values of several dyes in 3 different solvent systems. Students will also analyze an unknown mixture of dyes in order to identify the dyes present in the mixture. The three different solvent systems are 1) laboratory water, 2) an ...
Conduct a paper chromatography project to find out if different types of solvents separate ink differently. Set up the experiment using coffee filters and permanent markers. Cut the coffee filters into long strips. Form a loop by stapling the ends of each strip together. Place a dot of ink on the bottom of the coffee filter strips.
paper chromatography is the retention factor, commonly denoted as the R f value. This equates to . 3 ... For this lab, I developed a hypothesis regarding the solutions that would best identify my unknown ink samples: "Based on observations of the base paper chromatogram [the fact that the some of the pen ...
Step 1: Hypothesize/Predict: Discuss with your lab partner what color pigments will likely be present in the spinach leaves. Write your predictions in your lab notebook and draw a diagram of how you think the pigments will separate out on the chromatography paper. Step 2: Student-led Planning: Read step 3 below.
Perform Paper Chromatography on Leaves. The key steps are breaking open the cells in leaves and extracting the pigment molecule and then separating the pigment using the alcohol and paper. Finely chop 2-3 leaves or several small leaves. If available, use a blender to break open the plant cells.
Fill a capillary tube by placing it in the leaf extract (it will fill by capillary action). Keep your finger off the end of the capillary tube. Apply the extract to the center of the dot (e) on the paper by quickly touching the end of the TLC applicator to the plate. Allow to dry (you can gently blow on the strip).
to handle paper as little as possible. 1. Cut a piece of Whatman #1 filter paper or chromatography paper to the dimensions of 12 cm X 14 cm. Edges must be straight. 2. With a pencil lightly make a line 1.5 - 2 cm from the bottom edge of the paper which measures 14 cm. 3. Select 2 large dark green spinach leaves and blot dry with paper towels.
Chemists and biologists also use chromatography to identify the compounds present in a sample, such as plants. In this science project, you will explore how the use of different stationary and mobile phases can affect the separation of marker ink. You will use chalk, chromatography paper, isopropyl alcohol, acetone, turpentine, and water.
Chromatography is using a flow of solvent or gas to cause the components of a mixture to migrate differently from a narrow starting point in a specific medium, in the case of this experiment, filter paper. It is used for the purification and isolation of various substances. A chromatographically pure substance is the result of the separation.
Instructions. Pour a small amount of water onto a plate or into the bottom of a jar. Find a way to suspend the filter paper over the water so just the very bottom is touching the water. If you do the experiment in a jar, the easiest way to do this is to wrap the top of the filter paper around a pencil, clip it in place and suspend it over the ...
This video introduces the general ideas behind chromatography and separation by polarity, describes how to report the conditions and results of a chromatogra...
1. Prepare a 0.1% salt solution by dissolving approximately 1⁄8 tsp salt in 3 cups of water inside. a bowl. Pour the salt solution into a wide mouth jar (see materials list) to a depth such that no more than 0.5 cm of the filter paper would touch the solution if the paper was suspended from the top of the container. 2.
The video gives an overview of what paper chromatography is, shows how it is done, explains the separation processes involved, and also provides tips and tricks for troubleshooting your experiment. In this science project, you can use a simple paper chromatography setup to see if black ink is just one component or a mixture of several components.
Add a pinch of sand and about six drops of propanone from the teat pipette. Grind the mixture with a pestle for at least three minutes. On a strip of chromatography paper, draw a pencil line 3 cm from the bottom. Use a fine glass tube to put liquid from the leaf extract onto the centre of the line. Keep the spot as small as possible.
paper chromatography, in analytical chemistry, technique for separating dissolved chemical substances by taking advantage of their different rates of migration across sheets of paper.It is an inexpensive but powerful analytical tool that requires very small quantities of material. The method consists of applying the test solution or sample as a spot near one corner of a sheet of filter paper.
Candy chromatography is a type of paper chromatography that is easy, inexpensive, and fun. The basic materials are colored candies, water, and coffee filters. The process separates the pigments in the dyes that color the candies. Here are two sets of candy chromatography instructions. The first targets young children and raises interest in ...
The wear resistance, porosity, and ion-exchange properties of steam-activated cokes in the form of cylindrical granules, obtained from Dorlastan polyurethane-polyamide fiber waste and cotton grass-sphagnum peat under conditions of purely kinetic control were studied at the combustion loss increased to 50%.
Find detailed information on Pulp, Paper, and Paperboard Mills companies in Elektrostal, Moscow Region, Russian Federation, including financial statements, sales and marketing contacts, top competitors, and firmographic insights. Dun & Bradstreet gathers Pulp, Paper, and Paperboard Mills business information from trusted sources to help you ...
Find company research, competitor information, contact details & financial data for BETA GIDA, OOO of Elektrostal, Moscow region. Get the latest business insights from Dun & Bradstreet.
Industry: Drugs and Druggists' Sundries Merchant Wholesalers , Converted Paper Product Manufacturing , Newspaper, Periodical, Book, and Directory Publishers , Printing and Related Support Activities , Pharmaceutical and Medicine Manufacturing See All Industries, Drugs and drug proprietaries, Converted paper products, nec, Miscellaneous publishing, Commercial printing, nec, Bookbinding and ...