Accessibility Links
- Skip to content
- Skip to search IOPscience
- Skip to Journals list
- Accessibility help
- Accessibility Help
Click here to close this panel.

Purpose-led Publishing is a coalition of three not-for-profit publishers in the field of physical sciences: AIP Publishing, the American Physical Society and IOP Publishing.
Together, as publishers that will always put purpose above profit, we have defined a set of industry standards that underpin high-quality, ethical scholarly communications.
We are proudly declaring that science is our only shareholder.

Prevention and control measures for coastal erosion in northern high-latitude communities: a systematic review based on Alaskan case studies
Min Liew 1,4 , Ming Xiao 1 , Benjamin M Jones 2 , Louise M Farquharson 3 and Vladimir E Romanovsky 3
Published 19 August 2020 • © 2020 The Author(s). Published by IOP Publishing Ltd Environmental Research Letters , Volume 15 , Number 9 Citation Min Liew et al 2020 Environ. Res. Lett. 15 093002 DOI 10.1088/1748-9326/ab9387
You need an eReader or compatible software to experience the benefits of the ePub3 file format .
Article metrics
17450 Total downloads 134 Video abstract views
Share this article
Author e-mails.
Author affiliations
1 Department of Civil and Environmental Engineering, The Pennsylvania State University, University Park, PA 16802, United States of America
2 Institute of Northern Engineering, University of Alaska Fairbanks, Fairbanks, AK 99775, United States of America
3 Geophysical Institute, University of Alaska Fairbanks, Fairbanks, AK 99775, United States of America
4 Author to whom any correspondence should be addressed.
Min Liew https://orcid.org/0000-0002-5156-4610
Benjamin M Jones https://orcid.org/0000-0002-1517-4711
- Received 13 November 2019
- Accepted 15 May 2020
- Published 19 August 2020
Peer review information
Method : Single-anonymous Revisions: 1 Screened for originality? Yes
Buy this article in print
Erosion along high-latitude coasts has been accelerating in recent decades, resulting in land loss and infrastructure damage, threatening the wellbeing of local communities, and forcing undesired community relocations. This review paper evaluates the state of practice of current coastal stabilization measures across several coastal communities in northern high latitudes. After considering global practices and those in northern high latitude and arctic settings, this paper then explores new and potential coastal stabilization measures to address erosion specific to northern high-latitude coastlines. The challenges in constructing the current erosion control measures and the cost of the measures over the last four decades in northern high-latitude regions are presented through case histories. The synthesis shows that among the current erosion controls being used at high latitudes, revetments built with rocks have the least reported failures and are the most common measures applied along northern high-latitude coastlines including permafrost coasts, while riprap is the most common material used. For seawalls, bulkheads, and groin systems, reported failures are common and mostly associated with displacement, deflection, settlement, vandalism, and material ruptures. Revetments have been successfully implemented at sites with a wide range of mean annual erosion rates (0.3–2.4 m/year) and episodic erosion (6.0–22.9 m) due to the low costs and easy construction, inspection, and decommissioning. No successful case history has been reported for the non-engineered expedient measures that are constructed in the event of an emergency, except for the expedient vegetation measure using root-wads and willows. Soft erosion prevention measures, which include both beach nourishment and dynamically stable beaches, have been considered in this review. The effectiveness of beach nourishment in Utqiaġvik, Alaska, which is affected by permafrost, is inconclusive. Dynamically stable beaches are effective in preventing erosion, and observations show that they experience only minor damages after single storm events. The analysis also shows that more measures have been constructed on a spit (relative to bluffs, islands, barrier islands, and river mouths), which is a landform where many Alaskan coastal communities reside. The emerging erosion control measures that can potentially be adapted to mitigate coastal erosion in high-latitude regions include geosynthetics, static bay beach concept, refrigerating techniques, and biogeochemical applications. However, this review shows that there is a lack of case studies that evaluated the performance of these new measures in high-latitude environments. This paper identifies research gaps so that these emerging measures can be upscaled for full-scale applications on permafrost coasts.
Export citation and abstract BibTeX RIS
1. Introduction
High-latitude coastlines are influenced by several factors that set them apart from lower latitude coastlines including the presence of sea-ice and permafrost and are among the most dynamic in the world (Jones et al 2009a , Mars and Houseknecht 2007 , Overeem et al 2011 , Lantuit et al 2012 , Farquharson et al 2018 , Irrgang et al 2018 , Novikova et al 2018 In some cases, high rates of coastal change can threaten coastal infrastructure and communities and create a need for erosion prevention. Solomon and Covill ( 1995 ) and Cunliffe et al ( 2019 ) noted that, rather than a slow steady process, erosion can occur in an episodic manner with short-term erosion rates that greatly exceed the long-term average rate. Accelerating rates of erosion at high-latitudes can be attributed to a longer open-water period or sea ice decline (Overeem et al 2011 , Cai et al 2018 , Farquharson et al 2018 , Kwok 2018 ), shifting of shorefast ice to frazil ice (Aré et al 2008 ), shifting of multiyear ice to seasonal sea ice (Kwok 2018 ), sea surface temperature (Costard et al 2007 , Overeem et al 2011 ), more frequent or severe storms (Manson and Solomon 2007 ), and the warming and thawing of permafrost (Nelson et al 2001 , Romanovsky et al 2010 , Rowland et al 2010 , Grosse et al 2011 , Sinitsyn et al 2020 ). More recently, Jones et al ( 2018 ) demonstrated a sustained increase in erosion over the last decade along the highly dynamic permafrost-affected Drew Point section of the Beaufort Sea coastline and the complexities associated with the factors most responsible for interannual variability in permafrost bluff erosion. Farquharson et al ( 2018 ) also demonstrated the complexities of coastal changes in permafrost regions by highlighting the high spatial variability of these changes across various types of coastal morphology and an increasingly dynamic permafrost coast of northwest Alaska. Lantuit and Pollard ( 2008 ) also reported such complexities after observing a decrease in mean annual rate of shoreline erosion on Herschel Island, which is also a permafrost-affected region, but an increase in erosion rate for segments of these shorelines with high ground ice content.
The economic impacts of climate change on Alaska's infrastructure and land losses associated with coastal erosion have been quantified under various climate forcing scenarios (Cole et al 1999 , Larsen et al 2008 , Melvin et al 2016 ). In general, studies indicate that projected climate change could impose additional costs due to infrastructure damage in Alaska and across the pan-Arctic (Hinkel et al 2003 , Hjort et al 2018 ). Such climate-induced expenditures increase substantially as more comprehensive infrastructure inventories are considered. The uncertainties in climate projections (Friedlingstein et al 2014 , Nordhaus 2018 ) may also increase the uncertainties in these predicted expenditures. A recent study by Melvin et al ( 2016 ) showed that cumulative costs of climate-related damages to Alaskan infrastructure from year 2015 to 2099 were estimated to be $5.5 billion for Representative Concentration Pathway (RCP) 8.5 (representing the highest greenhouse gas emissions scenario projected by the Intergovernmental Panel on Climate Change (IPCC)) and $4.2 billion for RCP4.5 (representing stabilizing greenhouse gas emissions scenario).
Due to the severe impacts of coastal erosion on the lives and livelihood of northern indigenous communities and the high costs of implementing coastal protection, some villages have started to consider community-based relocation. The urgency and constraints of community-based relocations due to coastal erosion have been discussed in many studies (Shearer 2012 , Marino 2012 , Bronen and Chapin 2013 , Gorokhovich et al 2013 , Maldonado et al 2013 , Bronen 2015 ). These studies generally agree that erosion, which has been considered a slow geomorphological process, should now be included under the statutory definition of disaster, and relocations should be community-led and government-supported so that the displacement efforts are in agreement with the culture and traditional values of local communities (Bronen et al 2019 ).
In some northern high-latitude populated regions with high coastal erosion rates, plans were established for community relocations and efforts are underway for the construction of erosion control structures (Radosavljevic et al 2016 , Novikova et al 2018 , Irrgang et al 2019 ). The efforts, however, are insufficient to address coastal erosion in high-latitude regions, especially those influenced by permafrost, and are currently of little help to local residents in adapting to and transitioning into a new coastal norm that is characterized by high erosion rates and a more dynamic coastal system. This is because the erosion prevention structures were designed based on their local historical trends, while the trends are dynamically changing and the structures can no longer be effective. Given the social context of the indigenous people and their long history of ties to the land and sea, community-based relocations are often complex and not feasible. Even when relocation is attempted, such as the case in Shishmaref, Alaska, which is affected by rapid barrier island migration and coastal erosion, the planning can last for more than 10 years and the relocation costs are projected to be at least about $180 million (Marino 2012 ). Erosion prevention structures are still in need even in those plan-to-move communities to help reduce damages to current civil infrastructures while planning and implementation take place. Therefore, there exists an urgency of identifying potential adaptations for northern high-latitude coastal erosion and change. One method of identifying potential adaptations is through a systematic review on the prevention of coastal erosion in key northern high-latitude areas.
Coastal stabilization projects have been one of the most challenging types of construction faced by contractors globally due to the complexities of various environmental forcing factors such as storm impacts, sediment transport, and deposition patterns. Site specific risks, which are sometimes difficult to be distinguished from other factors, can lead to catastrophic failures of the coastal protection structure in question. Errors in field investigations, design, construction, and maintenance can also reduce the effectiveness of the measures. In addition, extremes of climate and weather, which are changing from historical values (Ayyub 2018 ), introduce more uncertainties to coastal engineering practice at local levels. Such projects, when located at northern high latitudes, are further complicated by the presence of sea ice, changes in sea ice extent, the harsh frigid environment, permafrost thaw, and thermokarst. Across the highly scattered scientific publications and gray literature, opinions and evidence regarding the effectiveness of long- and short-term high-latitude coastal erosion control vary greatly. While some studies (e.g. Ogorodov 2003 , Carter and Smith 2011 , Bronen and Chapin 2013 ) have argued that shoreline protection exacerbates land erosion on adjacent land, others (e.g. Andrachuk and Smit 2012 ) show evidence that erosion prevention measures are effective in the long run. A systematic review of northern high-latitude coastal erosion controls is therefore necessary to understand which measures have worked and which did not.
This paper reviews the current erosion control practices being applied globally, with a focus on northern high-latitude communities (primarily in Alaska due to data availability), and explores potential measures that can effectively prevent or slow coastal erosion in northern high-latitude communities. Within this paper we (1) summarize the challenges in constructing erosion control measures in northern high-latitude regions and the solutions proposed in the literature, (2) synthesize and conduct a meta-analysis on case histories from scientific and gray literature publications both in permafrost and non-permafrost regions, (3) discuss the rationale, benefits, limitations, and costs of applying each prevention technique, (4) explore emerging techniques and technologies, and (5) identify the knowledge gaps in prevention of coastal erosion at northern high latitudes. The innovative techniques include those that have been tested in full-scale, small-scale research projects, laboratory settings, and numerical models. The costs of the current coastal erosion prevention measures are included to reflect the unit cost increase over the years in Alaska. The goal of this research is to assess past attempts at prevention and control of erosion along northern high-latitude coasts, so that this review may be used as a reference for decision-making for mitigating the impacts of erosion in northern high-latitude coastal villages in the future.
2. Data compilation of erosion control measures
The case histories and research studies of erosion control projects in this study are compiled from journal and conference articles and government documents. The databases that have been searched include the Northern Region Projects by the Alaska Department of Transportation and Public Facilities (ADOT&PF), documentation of Alaska Baseline Erosion Assessment by U.S. Army Corps of Engineers (USACE), the Denali Commission Project Database, and the documentation of Emergency Watershed Protection Program by Alaska Natural Resources Conservation Service (NRCS). According to USACE ( 2009d ), other agencies such as the National Oceanic and Atmospheric Administration (NOAA), U.S. Geological Survey (USGS), Federal Emergency Management Agency (FEMA), Bureau of Land Management, and U.S. Forest Service only occasionally assisted with erosion control projects in the Alaskan coastal communities. As a result, most of the protection measures in the Alaskan coastal communities that are discussed herein are extracted from the USACE database.
3. General challenges of construction at northern high latitudes
There are many challenges in the construction in the remote northern high-latitude coastal regions, including remoteness of construction sites, limited construction material, and extreme environmental conditions (see summary in supplementary table S1 (available online at stacks.iop.org/ERL/0000/0000/mmedia )). Challenges can be grouped into three main categories: geographic challenges, engineering challenges, and socio-economic challenges. Geographic challenges include site remoteness, extreme weather, highly variable site conditions, and short construction period. The engineering challenges include unavailability of equipment and instrumentation, unavailability of local construction materials, and limited database (e.g. documentation of environmental parameters and soil parameters, design and construction guidelines of erosion control measures that are specific to permafrost coastlines, and case studies of well-engineered northern high-latitude coastal structures). The socio-economic challenges consist of policy inadequacy, low labor retention, and vandalism. Solutions that are proposed in this paper and by those from the literature are synthesized accordingly to each challenge in supplementary table S1.
4. Coastal erosion processes at northern high latitudes
Erosion control structures should be selected and designed according to the types of coastal settings at a site in order to optimize the structure performance. It is therefore important to understand coastal erosion processes that are specific to northern high-latitude sites. Permafrost-affected sandy beaches at northern high-latitudes are dominated by erosion processes common in non-permafrost regions such as steepening of foredunes and transport of beach sediments on gently sloping shores (Farquharson et al 2018 ). In contrast, where ice-rich permafrost is present, thermal abrasion is the main coastal erosion process. Aré ( 1988 ) defined thermal abrasion as erosion of ice-rich permafrost coasts due to combined mechanical and thermal action of waves at the under-water bluff base. Thermal abrasion then leads to the development of a wave-cut niche, leaving a cornice overhanging and eventually collapsing under its self-weight (Aré 1988 , Hoque and Pollard 2009 , 2016 ). This feature, which is unique to ice-rich permafrost coasts, is known as the block failure. Processes that are also unique to coasts affected by permafrost are thermally based and include thermal denudation and thermal settling. Thermal denudation is the destruction of shore cliffs under the action of thermal energy of air and solar radiation; while thermal settling is the deepening of littoral zone of the sea due to the thermal action of sea water, whose temperature depends on the air temperature, solar radiation, and ocean currents. As erosion progresses and leads to the landward migration of the shoreline, deeper terrestrial permafrost that persists below the level of coastal erosion may then become sub-sea permafrost (Overduin et al 2014 ).
The duration of coastal processes also varies seasonally and annually across the northern high-latitude coasts due to variability in the duration of sea ice coverage. In northern high-latitude regions not affected by sea ice, the open sea duration is year-long, similar to that at middle and low latitudes. In regions affected by sea ice, erosion is limited to the ice-free months but the degree of erosion is generally affected by seawater temperature and salinity and other arctic features such as pressure ridges, coastal geomorphology, and sea ice (Overduin et al 2014 ). Pressure ridges, if grounded with their keels extending to the nearshore bottom, can shelter shores from wave action and protect adjacent shorelines from further sea ice pressure (Taylor 1978 ). Nearshore profiles can easily be destabilized if the grounded pressure ridges are eroded by increased wave action owing to the decline in sea ice extent (Taylor 1978 ). Sea ice in various forms (e.g. ice pileup, landfast ice, and drift ice) can extensively modify the coastal morphology. For examples, ice pileup can gouge up sediments onto the land and restore beaches (Kovacs 1984 ) but can also erode the lower shoreface (Radosavljevic et al 2016 ) and damage coastal protection structures. Whereas, sea ice and landfast ice help prevent thermal abrasion (Mahoney et al 2007 , 2014 , Günther et al 2015 ). Unfortunately, the current decline in landfast ice and sea ice has rendered the permafrost coasts more susceptible to erosion. Such complex interactions among these arctic coastal features need to be accounted in the design of coastal protection structures.
In general, northern high-latitude coasts can be categorized into lithified (i.e. rocky) and unlithified coasts, depending on the regional histories of glaciation. Unlithified coasts, which have high ground ice content and are usually composed of fine-grained soils, are more susceptible to erosion. It was reported in Overduin et al ( 2014 ) that the annual mean rate of erosion (0.4–1.1 m/year) is the highest along the Beaufort and East Siberian coasts, where unlithified ice-rich low-height bluffs are the common coastal type. As expected, Canadian Archipelago, Greenland, and Svalbard, where lithified coasts dominate, have the lowest annual mean rates of erosion (0.0 m/year) (Overduin et al 2014 ). While the mean rates at these locations are low, it is important to note that they are averaged over a great distance of coastline and may not represent the local erosion.
5. Past attempts to improve understanding of coastal dynamics and site reconnaissance for mitigating coastal erosion at northern high latitudes
Understanding of high-latitude coastal dynamics is critical to the design of effective erosion control measures. In the early 2000s, the Arctic Coastal Dynamics (ACD) program involving all circumarctic countries was established and has significantly contributed to the understanding of such dynamics through a series of workshop proceeding publications. Arctic coasts have been regionally classified and correlated with their rates of erosion; attempts have been made to identify arctic coast types most susceptible to erosion. Along the Alaskan Beaufort Sea coast, Jorgenson and Brown ( 2005 ) concludes that exposed bluffs have the highest mean annual erosion rates (2.4 m/year), whereas lagoons have the lowest rates (0.7 m/year). Mean annual rates of erosion is also higher for silty soils (3.2 m/year). The sediments are mostly sands and silts and the bluff heights are low (2–4 m) (Jorgenson and Brown 2005 ). Moving eastward to the Beaufort-Mackenzie region in Canada (Solomon 2005 ) and Barents and Kara Sea key sites in Russia (Vasiliev 2003 , Vasiliev et al 2005 ), locations exposed to winds and high water level were also observed to erode at the highest rates. Erosion rates are also higher for coasts with high ground-ice content (Vasiliev et al 2005 , Solomon 2003 ). However, erosion can be reduced if there are natural protections such as bars and flats (Solomon 2005 , Gibbs and Richmond 2017 ).
Many have attempted to understand coastal dynamics along sea-ice and permafrost-affected coasts so that erosion and its impacts can be mitigated. Attempted approaches include developing an index of coastal erosion hazards (Solomon and Gareau 2003 , Jordan 2003 ), utilizing satellite data for coastal erosion monitoring (Budkewitsch et al 2004 ), developing numerical models (Hoque and Pollardz 2004 ), seismic reconnaissance (Skvortsov and Drozdov 2003 ), and digital terrestrial photogrammetry (Wangensteen et al 2007 ) to predict bluff failure and erosion rates. Other than the environmental forcing factors, impacts of industrial exploitation on coastal erosion have also been investigated (Rivkin et al 2003 , Ogorodov 2003 , Sturtevant et al 2004 ). Significant efforts have been made to quantify the current and historical erosion rates across the pan-Arctic (e.g. Jones et al 2009a , 2009b , Arp et al 2010 , Solomon 2005 , Lantuit and Pollard 2008 , Vasiliev et al 2005 , Lantuit et al 2011 , Günther et al 2012 ) so that hotspots of erosion hazard can be identified. Challenges of site investigation (Carter and Smith 2011 , Smith and Carter 2011 ), data collection (Mason et al 2012 ), construction (Carter and Smith 2011 , Smith and Carter 2011 ), and management (Smith 2008 ) in coastal regions in the Arctic were also reported.
6. Structural and non-structural erosion control measures
Damages from coastal erosion can be minimized by two different approaches: structural and non-structural measures. This paper includes only structural measures, which are defined in the United Nations General Assembly ( 2016 ) as measures that 'reduce or avoid possible impacts of hazards and achieve hazard-resistance and resilience in structures or systems.' Non-structural erosion control measures that 'use knowledge, practice or agreement to reduce risks and impacts' (United Nations General Assembly 2016 ) are not discussed in this paper. Some examples of the non-structural measures are joining the National Flood Insurance Program (Smith 2008 ), implementing No Adverse Impact (Monday and Bell 2007 ), zoning, buyout acquisition, recovery or excavation of cultural sites, remediation of contaminated sites, relocation or elevation of at-risk structures, emergency warning system and signage, erosion control management, graduate education (Smith 2006 ), individual research efforts (Smith 2006 ), and community-based relocation (USACE 2018 , Shearer 2012 , Marino 2012 , Bronen and Chapin 2013 , Gorokhovich et al 2013 , Maldonado et al 2013 , Bronen 2015 ).
All structural erosion control measures presented in this article are classified into several categories as shown in figure 1 . Two major categories are (A) techniques that are currently employed on northern high latitude coasts and (B) techniques that are not yet tested on northern high latitude coasts. Sub-categories that follow Categories A and B are techniques that have been implemented (1) in full scale, (2) in small-scale research projects or physical models, (3) in laboratories or numerical models, and (4) in small scale non-engineered projects. In this study, a structure is considered failing when it has been destroyed or displaced by environmental impacts (e.g. wave impacts, surges, sea-ice impacts, and permafrost thaw) and the repair would cost more than replacement. Another failure type refers to the ineffective measures where erosion exceeds the expected or predicted rates of erosion. A successful case refers to a measure that is not damaged or only slightly damaged when the encountered storm events are less severe than or equally severe to the design events. A measure is also considered successful if it is able to slow down or prevent erosion within the period of its designed service life when compared to adjacent sites with no coastal protection.

Figure 1. Categories of erosion control status used in this review.
Download figure:
7. Current erosion controls at northern high latitudes
Most case studies presented in this section are affected by coastal erosion while some are affected by fluvial erosion. Although these riverine communities are not affected by sea-ice and other processes specific to the coasts, the erosion control projects are affected by some similar factors unique to the northern high-latitude regions including remoteness, weather, and soil condition. So, the riverine experience may be helpful to the coastal communities and is therefore included in the discussion. The locations of northern high-latitude communities and facilities are presented in figure 2 with permafrost distributions as the base map. Figure 2 is adapted from the permafrost distribution maps by Brown et al ( 2002 ) and Jorgenson et al ( 2008 ).

Figure 2. Locations of northern high-latitude communities and facilities. The locations are indicated as red markers on the map of permafrost distributions. The Alaska permafrost map is adapted from Jorgenson et al ( 2008 ), and the permafrost map outside of Alaska is adapted from Brown et al ( 2002 ). The sites in Svalbard are presented in the bottom frame. The legend indicates the permafrost distributions (i.e. continuous permafrost, discontinuous permafrost, isolated permafrost, and sporadic permafrost), glacier, water body, and unspecified regions.
Most of the measures that have been employed in Alaskan coastal villages and other infrastructure locations are hard structures such as revetments, bulkheads, seawalls, groins, and offshore berms. Figure 3 shows examples of these measures at northern high latitudes. The permafrost distributions (i.e. continuous, discontinuous, sporadic, and isolated permafrost) were identified for each site as indicated as superscripts in the column titled 'Location' in supplementary table S2. Thus far, revetments built with various types of materials have been the most common option in preventing coastal erosion at northern high latitudes as presented in supplementary table S2. The materials include rocks (figure 3 (a)), sandbags (figure 3 (b)), articulated concrete mats (figure 3 (c)), Core-loc™ units, timbers, and gabions. Among all materials, revetments built with rocks have been implemented and tested in the harsh Arctic environment and were observed to have fewer failure cases. Revetments built with sandbags have also been proven effective as temporary and semi-permanent measures. USACE ( 2009c ) has conducted physical models to further optimize the stability of revetments built with sandbags. In general, revetments usually require maintenance throughout their service life as they can be easily displaced and destroyed during storm events or by sea-ice floes. Despite this limitation, revetments are preferred over seawalls, bulkheads, and other offshore structures due to the low costs and easy construction, inspection, and decommissioning (USACE 2018 ).

Figure 3. Various types of erosion control measures that have been employed at northern high latitudes. The photos were all taken at communities in the northern high-latitude regions. Image courtesies of U.S. Army Corps of Engineers, Alaska District (a), (b), (f), Dustin Whalen (c), Alaska Division of Homeland Security and Emergency Management (d), Worley Parsons (e), Millie Hawley (©2005) (i), and Janet Mitchell and Center for a Better Life (j). (g) to (j) are non-engineered expedient measures carried out during emergency.
Seawalls (figure 3 (d)) and bulkheads (figures 3 (e)–(f)) have also been constructed in northern high-latitude coastal communities. Similar to revetments, bulkhead and seawalls protect permafrost bluff faces from the development of niches, a critical stage in shoreline collapse (Hoque and Pollard 2009 , USACE 2018 ). For bulkheads, only one successful case using vertical sheet-piles is found in the literature review (USACE 2009a ). Bulkheads made of Longard tubes™ and pipe-piles were easily subjected to vandalism (Shah 1982 ) and excessive deflection (USACE 2007a , 2009d ), respectively. Whereas, one successful case using a seawall made of logs is found to be effective in mitigating fluvial erosion where the crib walls were constructed (USACE 2007h ). Seawalls made of gabions were not as effective due to potential sagging and settlement (USACE 2009b ); while seawalls made of sheet-piles were not cost-effective, for example, a sheet-pile wall in a project proposal was estimated to cost more than $31 million (in 2007 US dollars) for a 1 km long coastline (USACE 2007k ). The groin system is a less common option in northern high-latitude coastal communities with only one case study presented in supplementary table S2. Due to their complex offshore construction, groins are especially vulnerable to damage from sea-ice (USACE 2018 ). This paper is unable to identify a successful case study that used groin systems alone to mitigate erosion impacts. The erosion in Tuktoyaktuk in northwestern Canadian Arctic was reduced when the groin systems were installed together with bulkheads (Shah 1982 ). Similar to groin systems, offshore berms are not preferred at northern high latitudes due to costly and complex offshore construction. This option was once considered in the feasibility report in Kivalina but was eventually eliminated (USACE 2007k ). Overall, failures of seawalls, bulkheads, and groin systems are associated with displacement, deflection, settlement, vandalism, and material ruptures as presented in supplementary table S2.
In the event of an emergency, sacrificial structures have been constructed as expedient measures to minimize the erosion as shown in figures 3 (g)–(j). The materials used in sacrificial structures include sandbags, supersacks, ripraps, sand berms, and root-wads. Although the materials are the same as those used in the construction of hard structures, these sacrificial structures are ineffective when they are not properly designed and constructed. When in short supply, these materials are substituted using scrap metal and concrete and other waste materials. Such materials can potentially cause pollution. Based on the case histories presented in supplementary table S2, these measures are often ineffective in preventing or slowing erosion and require maintenance after each storm event (USACE 2007a , 2007d , 2007f , 2007g , 2007 j, 2008b , 2018 , Jaskólski et al 2018 ) and may sometimes exacerbate the adjacent coastline due to material mining (Carter and Smith 2011 ). Root-wads and willow planting are the only case histories that have been effective in preventing erosion, but the project is located in Cordova, which is a non-permafrost region of Alaska affected by riverbank erosion as shown in table S2 (USACE 2007a , Smith 2008 ).
Soft structures such as beach nourishment and dynamically stable beaches have also been implemented at northern high-latitudes. Beach nourishment requires continual sources of sand and is effective only when there are existing sources of sand adjacent to the sites. This solution is rarely used in northern high-latitude communities given the lack of local sand sources, transportation challenges and costs, the depletion of local construction materials, and the environmental issues brought by sand mining. As a result, only a few beach nourishment projects have been carried out along northern high-latitude coasts and these are presented in supplementary table S2. Beach nourishment is effective in Homer, Alaska (a non-permafrost region), but ineffective in Utqiaġvik, Alaska (a continuous permafrost region) where the storm events are more intense and sea ice can interfere with sand transport of the nourished beaches.
The other soft structure that has been implemented in northern high-latitude coastal communities is the dynamically stable beach. Specifications of the three dynamically stable beaches constructed in Alaska were presented by Smith and Carter ( 2011 ) and are summarized in supplementary table S2. Coarser sediments such as rocks, concrete armor units, and cobbles were used. The main difference between a dynamically stable beach and a nourished beach is that the former is designed according to the wave direction and is designed to be shaped by future storm events to reach equilibrium over time. Only minimal maintenance is needed for dynamically stable beaches, depending on the intensity of the storm events, whereas another beach-filling is needed for the nourished beach to continue its function after the first storm event. According to Smith and Carter ( 2011 ), all three dynamically stable beaches (i.e. one in Unalakleet, a village located on a spit near a river mouth in the discontinuous permafrost region of Alaska, and two in Unalaska and Homer in the non-permafrost affected region) have performed well and do not require high maintenance after storm events.
8. Meta-analysis of current measures with site characteristics
8.1. coastal landforms.
Alaskan coastal communities mostly reside at landforms such as bluffs with narrow beaches, spits, islands, barrier islands, and river mouths. Among the various landforms, spits are the most frequently resided (5 out of 13 locations collected in this study). In figure 4 , the frequencies of northern coastal communities at various coastal landforms are plotted in light gray; the frequencies of erosion control case studies (total number n = 32) collected in this study were plotted in dark gray. The frequency of the case studies indicate that more measures had been repeatedly constructed in barrier islands and spits. In general, the soil materials in villages range from silts, fine sands, sands, to cobbles. Little Diomede Island, which is an exception, is rich in rocks and boulders.

Figure 4. Frequencies of the northern high-latitude coastal communities and case studies for various coastal landforms. The y -axis represents the frequency counts of the numbers of villages or the numbers of case studies collected in this study. The raw data used to compute the bar chart are obtained from the literature, mostly from Alaska Baseline Erosion Assessment Reports (UMIAQ and BDS 2015 , USACE 2007b , 2007d , 2007k , 2007l , 2009a , 2007f , 2007g , Jaskólski et al 2018 ).
8.2. Rates of erosion
Figures 5 (a)–(b) shows boxplots of the mean annual erosion rates and erosion per single storm event reported at sites where the erosion controls were implemented. Numeric data used to generate the plots are included in supplementary table S3. As illustrated in figure 5 (a), revetments and bulkheads have been employed for sites with a wide range of mean annual erosion rates (0.3–2.4 m/year). As expected, groin systems, which are an offshore structure, have been employed at sites with high mean annual erosion rates (2.3 m/year); whereas, beach nourishment, dynamically stable beaches, and other non-engineered measures have been employed at sites with low mean annual erosion rates (0.3–0.9 m/year). However, seawalls were employed at sites with low erosion rates (0.3–0.6 m/year). It could be possible that seawalls were constructed in these sites to slow erosion after extreme episodic erosion (figure 5 (b)). Similarly, for revetments and bulkheads, the erosion reported per single storm event also ranged widely from 3.0 m to 22.9 m. The episodic events of erosion were at the lower ends for beach nourishment, dynamically stable beaches, and other non-engineered measures (6.0–10.7 m) with an outlier of 22.9 m for non-engineered measures. Seawalls, groins, and berms had been constructed at sites with high episodic erosion (17.0–22.9 m).

Figure 5. Statistical distributions of erosion rates at sites where erosion control measures were employed. (a) Mean annual erosion rates in m/year. (b) Amount of land eroded per a single storm event during the extreme cases. For the types of measures, Re = revetments, Bu = bulkheads, Se = seawalls, Gr = groins, Be = berms (no mean annual erosion rate was reported for berms), NG = non-engineered measures, BN = beach nourishment, and DS = dynamically stable beaches. Mean values are indicated as cross markers, while outliers are empty circles. Medians are indicated by the horizontal lines in the boxes. The raw data used to compute the boxplots are obtained from the literature, mostly from Alaska Baseline Erosion Assessment Reports (UMIAQ and BDS 2015 , USACE 2007b , 2007d , 2007k , 2007l , 2009a , 2007f , 2007g , Jaskólski et al 2018 ).
8.3. Proportions of various types of measures
Figure 6 (a) shows the proportion of the types of erosion control measures employed in the northern high-latitude coastal and riverine communities. Based on a total of 53 cases, revetments were most frequently employed (41%) and non-engineered measures were the second (23%). The measures that came after non-engineered measures are seawalls (11%), bulkheads (9%), dynamically stable beaches (8%), beach nourishment (4%), groins (2%), and berms (2%). Among the 53 cases at northern high latitudes, 38 of them were employed within permafrost regions (including continuous, discontinuous, sporadic, and isolated permafrost). For the rest of the cases ( n = 15), although they are influenced by northern high-latitude climate, they are located within non-permafrost regions. For the cases in permafrost regions, the percentage of revetments increases to 44% whereas the percentage of non-engineered measures reduces to 16%. Similarly, figure 6 (b) shows the proportions of the types of materials. Among all the cases collected in northern high-latitude regions, riprap is the most frequently used material, accounting for 40% of the materials. Sand or sandbags and sheet piles are both the second (11% for each). For cases in permafrost regions, the percentage of riprap reduces to 34%, but both percentages of sand or sandbags and sheet piles increase to 13% and 16%, respectively. The percentage differences between counts in northern high-latitude regions and those in permafrost-affected northern high-latitude regions are indicated on the pie charts in brackets. The percentages of the measures (in table 1 , the column 'Grouped percentages') computed in this study are compared to those (in table 1 ; the last column) reported in a survey 'Alaska Community Erosion Survey' conducted by USACE ( 2009f ). In this survey (USACE 2009f ), the Alaskan coastal communities were asked to indicate the types of materials that have been used in their communities to prevent coastal erosion. The results reported in this paper, which were computed based on case studies reported in the literature, were comparable to the survey with riprap (including rocks and cobbles) being the most frequently used measures and geo-tubes being the least popular option.

Figure 6. Proportion of types of (a) erosion control measures and (b) materials employed in northern high-latitude communities. Values not in brackets represent proportions for all case studies at northern high latitudes; the values in brackets are the comparisons with those in permafrost areas. Values in red indicate higher percentages for the cases in permafrost regions compared to all northern high-latitude cases, and vice versa for values in green.
Table 1. Percentages of various types of measures discussed in this study and percentages of measures covered by the 2009 USACE survey data.
8.4. Effectiveness of current measures reported in community survey
In the same survey by USACE ( 2009f ), the communities were asked about the effectiveness of the erosion control measures currently employed in their communities; 84% of the community respondents ( n = 44) indicated that the measures had been effective. The communities were further asked about whether there had been a failure in the past in their communities; 100% of the respondents ( n = 23) indicated that there had been a failure. In general, the communities reported that the current measures cannot fully prevent erosion, are not adequate for large scale protection, and have been heavily damaged due to lack of repair and maintenance. It is likely that these past measures were designed without adequate site investigations and without the considerations of the changing climate. As a result, these measures were only able to prevent mild constant erosion but not extreme erosion in an episodic manner and may fail in future storm events.
9. Costs of erosion control measures at northern high latitudes
The cost of erosion controls in Alaska has been escalating over time even for the expedient measures that were built during the planning of community relocations such as those in Kivalina and Shishmaref (USACE 2009d ). Supplementary table S4 shows the type of protection measure for each case history and the corresponding length of the structure, cost, and year of construction. The map of permafrost distributions developed by Brown et al ( 2002 ) and Jorgenson et al ( 2008 ) were used to identify permafrost distributions (i.e. continuous, discontinuous, sporadic, and isolated permafrost) for each site as indicated as superscripts in the column titled 'Communities in Alaska' in supplementary table S4. The cost per meter of erosion control measures that have been implemented or recommended in the feasibility studies are plotted in figure 7 over 40 years from 1979 to 2018. Inflation is accounted by converting the costs to 2019 US dollars using the Consumer Price Index Inflation Calculator developed by the U.S. Bureau of Labor Statistics ( 2019 ). It is important to note that the impacts and concerns on coastal communities and facilities predate the 40-year time interval, dating back to the well-known 1963 storm event in Utqiaġvik, Alaska; this storm event is widely used as a historical reference in the North American literature. However, this 40-year time interval was selected mainly because of the availability of reports and documents specific to coastal protection structures. The early review paper by Aré ( 1988 ) might have inspired more efforts (and therefore more documentation) to be made in the field of coastal erosion protection since then.

Figure 7. Cost per meter of coastal erosion controls from year 1979 to 2018 along Alaskan coasts. Inflation is accounted by converting the costs to 2019 US dollars using the consumer price index inflation calculator developed by the U.S. Bureau of Labor Statistics ( 2019 ).
As shown in figure 7 , the unit cost has increased (approximately 10% increase per year) in the past four decades. The costs of breakwaters (figure 7 , blue diamond-shaped markers) and bulkheads (figure 7 , purple circle marker) are above the average cost. The cost of gabion seawall construction is below average and beach nourishment falls on the average cost. Although the estimated cost of the beach nourishment seems to fall within the median range as shown in figure 7 , its cost is considerably high when compared to the average cost in mid- to low-latitude regions. For an 8 km shoreline in Utqiaġvik, AK (USACE 2018 ), for example, the initial cost of the beach nourishment was estimated at $297 431 000 (in 2018 dollars). This results in a cost of approximately $37 000 per meter for initial construction. However, in mid- to low-latitude regions, the initial construction cost for beach nourishment ranges from only $6600–$16 000 per meter of coastline (SAGE 2015 ). This infers that the initial cost to practice beach nourishment in a northern high-latitude region is at least 2 times the cost needed for a mid- to low-latitude region. Similarly, in mid- to low-latitude regions, the initial construction cost for bulkheads ranges from $6600–$33 000 per meter (SAGE 2015 ). However, the bulkhead in Dillingham, Alaska, which is a northern high-latitude village affected by fluvial erosion, costs about $53 000 per meter in 2019 US dollars (USACE 2009d ). This is equivalent to a cost that is approximately 1.6 to 8 times higher than the cost needed for a similar application at middle to low latitudes.
9.1. Meta-analysis of cost of erosion control measures
A statistical analysis was further performed on the case studies with reported construction cost (figure 8 ). As expected, breakwater, which is an offshore structure, has higher median cost than the other measures (figure 8 (a)). Such trend is much clearer when comparing breakwater to revetment but not the other measures since only one data point is available for bulkhead, seawall, and beach nourishment. The low unit cost of revetments may be one of the reasons that lead to the popularity of revetments (as illustrated by the high frequency of revetment in figure 8 (b)) in controlling coastal erosion in Alaska.

Figure 8. Statistical distributions of (a) unit cost in 2019 US dollars and (b) how frequently various types of coastal erosion controls are implemented. For the boxplots, mean values are indicated as cross markers; medians are indicated by the horizontal lines in the boxes. The vertical axis of chart (b) refers to the number of case studies.
Although breakwater, which is mostly constructed in non-permafrost regions, has a higher median cost, the cost (both unit and total costs) of erosion control measures in permafrost regions is higher (in figures 9 (a) and (b)). This is likely because a revetment costs more if constructed in a permafrost region, driving up the cost of overall measures. In addition, it is noted in figure 9 that the difference in medians between permafrost and non-permafrost is higher for the unit cost but not as much for the total cost. This is because the length of coastline protected by the measures in non-permafrost regions is generally longer.

Figure 9. Comparison of costs (in 2019 US dollars) of coastal erosion control in permafrost ( n = 15) and non-permafrost ( n = 7) regions. (a) Unit cost. (b) Total cost. Mean values are indicated as cross markers. Note: the mean total cost for measures in permafrost regions is skewed by an outlier (i.e. a beach nourishment project that was proposed in Utqiaġvik in 2018 and was projected to cost about $439 M in 2019 US dollars), which is not presented in the chart, so that the boxplots can be better illustrated.
10. Potential erosion control measures or techniques
The potential prevention measures or techniques that have been used in mid- to low-latitude regions or assessed for their potential application in Arctic systems are synthesized and categorized into four different applications: geosynthetics, static bay beach concept, refrigerating techniques, and biogeochemical application. Geosynthetics have been implemented in full-scale applications in various forms to control coastal erosion in mid- to low-latitude regions as shown in supplementary table S5. They were used as offshore structures (e.g. breakwaters) and onshore structures (e.g. sand-bagged seawall, sand-bagged revetments, and wrap-around revetments). Martinelli et al ( 2011 ) observed that high-density polyethylene (HDPE) sandbags when constructed as submerged barriers resisted a strong storm surge in Emilia-Romagna, Italy in December 1996 and stabilized a natural sandy beach profile. When constructed as a seawall, the sandbags resisted a significant wave height of 5 m (Corbella and Stretch 2012 ). Another type of geosynthetic application, revetments constructed using Geotube® units, prevented erosion at a localized segment of coastal bluff (Nickels and Heerten 1996 , Yasuhara et al 2012 ). Geotube® units can be a potential protection measure during emergencies given its short construction duration of less than one hour per Geotube® (Shin and Oh 2007 ). Another emerging geosynthetic application is geotextile wrap-around revetments (GWR). The GWR structure in Sylt Island in Germany was effective in resisting wave action during intense storm events in 1993 and 1994 and prevented coastal erosion by more than 10 m when compared to adjacent coastlines (Nickels and Heerten 1996 , Yasuhara and Recio-Molina 2007 , Yasuhara et al 2012 ). Although the sand-covered structure was exposed after the storm events, it was not damaged. Small-scale geosynthetic applications incorporating geotextile bags with conventional methods (e.g. breakwater) have been implemented in some northern high-latitude sites. The geotextile sandbags were designed and installed in Longyearbyen and Barryneset in Svalbard in 2005 for an experiment to develop geosynthetics products for cold climates (Caline 2010 ). The USACE ( 2009c ) started to consider using geosynthetic applications along the Alaskan coasts given the successful case studies across low to high latitudes.
The static bay beach concept (SBBC), as synthesized in supplementary table S6, is similar to the dynamically stable beach presented in supplementary table S2. This application mimics the shapes of natural bays and beaches. It prevents erosion by allowing a shoreline to reach static equilibrium through incorporations of natural or artificial physiographic features (preferably a headland). Several case studies in northern high-latitude regions have demonstrated the effectiveness of the static bay beach concept. While the principle employed is the same at both the permafrost and non-permafrost sites, relatively coarse fill materials were selected and used for the permafrost sites in order to dissipate greater wave energy. The benefits of the static bay beach are its low costs and its satisfactory performances in the long term when compared to other hard measures (Hsu et al 2010 , Carter and Smith 2011 ).
Refrigerating systems such as thermosyphons have traditionally been utilized at permafrost sites to improve the stability of roadbeds and embankments (Regehr et al 2012 ). There are three different types of thermosyphons: active, passive, and hybrid. An active thermosyphon uses a heat pump to transfer heat (Wagner 2014 ). A passive thermosyphon uses working fluid to transfer heat from its evaporator (in the ground) to its condenser and radiator (above the ground) when air temperature is lower than the ground temperature (Gudmestad et al 2007 ); this heat transfer process does not utilize external power and ceases during the summer when the air temperature is higher than the ground temperature. A hybrid thermosyphon integrates the functions of both active and passive thermosyphons and operates with natural convection during winter months (when air temperatures are sufficiently low) and with a heat pump during summer months (when air temperatures are above 0 °C). According to Dupeyrat et al ( 2011 ), an increase in ground temperature can cause the frozen ground to thaw. Such phase change of ice within the permafrost results in excess water content, which in turn reduces the cohesion and shear strength of permafrost. So, the erosion resistance of thawed soil decreases; as a result, the rate of erosion increases. In brief, erosion can be potentially prevented or reduced if ice-bonded sediments can be kept below its freezing point. To date, this technique has only been applied in small scale to improve the stability of critical infrastructure such as the communication towers in Kwigillingok, Alaska, the power plants in Utqiaġvik, Alaska, the hangar facility in Deadhorse, Alaska, and the college in Inuvik, Canada (Wagner 2014 ). Recently, a thermosyphon system with 3 meter spacings was also proposed to mitigate river erosion in Kotlik in the sporadic permafrost zone of Alaska, but the proposal was eventually eliminated due to the high cost (Roberts et al 2019 ). Although conventional thermosyphons (typically installed with 3 m spacings) cost about $1 M per km, they require minimal maintenance throughout their service life. Zottola ( 2016 ) proposed to use two-phase passive thermosyphons to alleviate coastal erosion through freezing near-thawing soils. The numerical models with soil and climate data from Drew Point and Utqiaġvik, Alaska as input parameters showed that thermosyphons are capable of slowing permafrost coastal erosion (Zottola 2016 ) but further refinement of the design is needed to optimize its cost. Detailed information for the case studies of thermosyphons are summarized in supplementary table S7.
The microbial application is an emerging technique that has been applied to control internal and surface erosion and its overall effectiveness has been rated highly (Dejong et al 2013 ). Many research studies have focused on developing the technique to be ready for real-world applications, and some studies have begun to investigate the performance of microbial application at coastal bluffs and sand dunes to mitigate coastal erosion (Phillips et al 2013 , Imran et al 2019 , Shahin et al 2020 ). Detailed information of the two case studies that may be applicable to the northern high-latitude sites are presented in supplementary table S8. One of them is a bench-scale project, investigating the performance of sporosarcina pasteurii in mitigating erosion of sandy soils of foreshore slopes and sand dunes (Salifu et al 2016 , Shanahan and Montoya 2016 , Shanahan 2016 ). Sporosarcina pasteurii is a bacterium with the ability to precipitate calcite and cement sand particles given a calcium source and urea, through the process of microbiologically induced calcite precipitation (MICP) or biological cementation. The treated soils showed above-moderate unconfined compressive strength and improved the performance of sand dunes under wave-simulation. The wave-action-induced erosion was significantly reduced when the sand was treated with a microbial solution (Salifu et al 2016 ). The other study was conducted using native microbes to cement sand to develop artificial beach-rocks that are durable enough to replace concrete structures in erosion control projects (Khan et al 2015 , 2016 ); coral sand and ureolytic bacteria from beach-rocks in Nago, Japan were used in the study. An average unconfined compressive strength of 12 MPa was achieved for the artificial beach rocks after 14 d of curing. This technique can potentially resolve the shortage of local quarries in remote northern high-latitude villages and control the escalating cost of rocks and ripraps.
11. Research gaps and challenges
To date, the potential erosion control measures and techniques described in the previous section have not been fully tested in the northern high-latitude regions. Some of them have not been evaluated even under the laboratory-simulated northern high-latitude conditions. Here we assess their strengths and weaknesses within the northern high-latitude environment and identify research gaps that need to be filled before field implementation.
11.1. Geosynthetics
Among the potential erosion control measures and techniques that we researched, geosynthetics currently have the greatest potential to be applied along the northern high-latitude coasts given their successful field applications in the past. Erosion has been controlled using geosynthetics from sparsely-located individual geosynthetic sandbags to well-designed seawalls constructed using geosynthetic materials. However, the main challenge of using geosynthetics is the prolonged UV exposure by 24 h daylight a day in the summer. Developing UV resistant and non-degradable geosynthetics is needed for northern high-latitude applications. Geosynthetic materials, which can be easily decommissioned, may be an effective option for temporary erosion control so that the threats to environment can be reduced (Sinitsyn and Recker 2019 ). However, if not properly monitored, the degraded geosynthetic materials can pollute the environment, posing threats to arctic wildlife. The degradation of geosynthetic materials in harsh and frigid northern high-latitude environments (e.g. impacts of ice-floes and prolonged exposure to subzero temperatures) can further complicate the problem by allowing brittle ruptures of sandbags to occur, resulting in sand leaking and excessive sand movement within the sandbags. Settlement and collapse of a seawall made of geosynthetic bags can occur if sand move excessively within those bags (Corbella and Stretch 2012 ). As a result, materials that remain flexible and non-brittle at low temperatures need to be identified; Caline ( 2010 ) therefore suggested that highly angular aggregates and those larger than 10 cm should be removed to avoid brittle puncture. Damage to geotextile sandbags by low temperatures or coastal ice can also be reduced by using thicker geotextile fabrics, but the seams on thick fabrics can be easily unpicked (Caline 2010 ). Therefore, the sewing machine and sewing threads need to be selected accordingly for the geosynthetics materials. In addition, the effects of sand movement on the overall stability of the geosynthetic structures need to be evaluated. The optimal sand-filled volume also needs to be determined for different combinations of locally-available filling materials and geosynthetics materials.
11.2. Static bay beach concept
One of the challenges of static bay beach concepts is to develop a process-based shape equation that can accurately simulate a northern high-latitude coastline with various coastal features. If simulated coastline profiles are not consistent with the real profiles, northern high-latitude beaches at static equilibrium will be difficult to maintain and final maintenance costs will vary substantially from their respective initial estimations. The current shape equation (i.e. Gainza et al 2018 ) is capable of modeling complex bathymetry incorporating influences of near shore islands, rock outcrops, and rocky platforms. For a shape equation to be effectively applied to a northern high-latitude coastline, effects of headlands, bluffs, barrier islands, spits, and ice ridges on the nearshore need to be considered in the equation. Another challenge is to identify the control points when applying a shape equation (Lausman et al 2010 ) as the final prediction of a static equilibrium shoreline highly depends on the initial selection. As those coastal features degrade due to thawing of permafrost or melting of ice, so do the controls points. The SBBC application also becomes more challenging when environmental forcing factors (e.g. sea ice, wave fetch, storm patterns) are changing due to climate change processes. Effects of these changes need to be reconsidered to predict the long-term equilibrium coasts at northern high latitudes.
11.3. Refrigerating system
The challenges of implementing thermosyphons are mostly associated with their up-scale field application in terms of high transportation costs and complex installation as compared with those of the traditional hard structures. Besides, given the high initial implementation costs of thermosyphons, they must be appropriately selected so that their capacities are flexible enough to account for the future climate and permafrost warming conditions. During summer months when air temperature is higher than the ground temperature, the heat pump of an active or a hybrid thermosyphon system needs to be activated to continue the heat transfer process. Heat pump operation may consume more energy if the mean annual air and ground temperatures continue to rise in a warming climate. The possibility of utilizing green energy such as the solar energy can be explored to lower the fuel consumption.
11.4. Microbial application
One of the concerns of applying MICP to the soils in northern high-latitude regions is the efficacy of the precipitate formation under cold temperatures. As reported in Cheng et al ( 2016 ), calcite can still form on grain surfaces at a temperature as low as 4 °C using Bacillus pasteurii although the amount of calcite formed per unit weight of sand at the temperature of 4 °C is 25% lower than that at 25 °C and the unconfined compressive strength is 56% lower. Performances of the calcite precipitation at 4 °C have also been assessed by Jiang et al ( 2016 ) using Bacillus megaterium and purified urease enzyme. B. megaterium was selected over Sporosarcina pasteurii as the former is more versatile and can grow at low temperatures (Jiang et al 2016 ). Efficacy of the calcite precipitation at temperatures lower than 4 °C needs to be evaluated in future studies to minimize the thermal disturbances to both the active layer and permafrost and to maintain the desired urealytic rates. Gomez et al ( 2015 ) developed a stiff crust, which has a high resistance to erosion, in the field using Sporosarcina pasteurii . This technique can be tried and tested at a bluff face to form a crust, which can potentially prevent niche development at the toe and insulate the permafrost beneath. However, the challenges include calcite degradation under freeze-thaw effects and wave impacts.
12. Choosing the optimal measures or techniques
The potential erosion controls are summarized in table 2 with their corresponding rationales, coastal types, tidal environments, and possible integration with conventional measures. The majority of the potential erosion controls are applicable to sandy coasts and are effective in a low energy setting. In the past Arctic coastlines (such as the North Slope of Alaska) were generally regarded as a low wave-energy environment where waves were damped by perennial sea ice cover (Owens et al 1980 ) these measures could be applicable to such shores. However, given that sea ice is now declining and high-latitude coastlines may transition into a more dynamic coastal system, these potential erosion controls may soon be inapplicable and need further development. Other than conventional solutions, the geosynthetic application could also be a good option for a high energy setting due to its several successful case histories in withstanding strong wave impacts and surges. Thermosyphon systems can also be used to dissipate high wave energy if integrated with sheet-pile walls or any equivalent measures. All of the potential erosion control measures and techniques discussed herein can be applied on the beach, except for the refrigerating systems, which are intended to be located on ice-rich permafrost bluff tops to keep them from thawing. The selection of erosion control measures is site-specific and is constrained by many factors such as cost, construction material availability, and contractors' skills and experience. At coastal sites where rocks are readily available, it may be more cost effective to continue to employ rock revetments to control erosion.
Table 2. Rationales of the potential erosion controls and the applicable soil types, coast types, and tidal environments.
Other than effectiveness, many factors (e.g. total costs, construction material availability, and sustainability) should also be considered in selecting the optimal coastal erosion control measures for a site. The life cycle cost analysis (LCCA), which is a quantitative approach that selects optimal measures based on their total costs over the life cycle, has been the primary framework used by USACE and construction companies. The total cost in LCCA includes the initial construction costs, annual maintenance and repair costs, operating costs, and inspection costs. However, analyses based on merely the total costs may not be adequate and the environmental impacts should also be considered. Recently, the life cycle assessment (LCA), which assesses environmental performance and impacts of a measure over its life cycle, including raw material extraction, manufacturing, use, disposal and recycling, are of rising interest in civil engineering (Singh et al 2011 , Dong and Frangopol 2016 , Raymond et al 2019 ). A combined assessment that incorporates both environmental and socio-economic impacts can be helpful for choosing the optimal coastal erosion control measures and should be transferred to coastal and geotechnical engineering in northern high-latitude regions.
13. Conclusions
This study investigates the conventional techniques that are currently used for northern high latitudes and emerging erosion control techniques applied globally that can potentially be adapted to prevent or limit coastal erosion in northern high-latitude regions. Challenges of implementing erosion prevention measures in northern high-latitude regions are summarized into three categories: geographical, engineering, and socioeconomical categories; the corresponding solutions, which are proposed in the literature, are also systematically documented in this review.
Meta-analysis is conducted on the case studies collected from scientific and gray literature publications. Our analysis shows that revetments built with rocks have the least reported failures among the current erosion controls and are the most common (41% of all measures) and cheapest measures applied in northern high-latitude settings, when compared to other less successful hard measures such as seawalls, bulkheads, and groin systems. Riprap is the most frequently used materials, accounting for 40% of the measures. No successful case history has been reported for the non-engineered expedient measures that are constructed in northern high-latitude regions in the event of an emergency. The effectiveness of beach nourishment as a soft structure in permafrost regions is inconclusive. However, dynamically stable beaches, which are also a soft structure, are effective in preventing erosion; observations show that they experience only minor damages after single storm events. Based on the collected case studies, we found that spits are landforms most frequently resided by the Alaskan coastal communities and more measures had been constructed on spits. Revetments have been implemented at sites with a wide range of mean annual erosion rates and episodic erosion due to the low costs and easy construction, inspection, and decommissioning.
By analyzing the cost of current erosion control measures in Alaska, in regions with and without permafrost, we show that the unit cost of erosion control structures has been escalating over the past 40 years (approximately 10% increase in cost per year). We also found that both the median unit cost and median total cost are higher for measures implemented in permafrost regions than those in non-permafrost regions; both permafrost and non-permafrost case studies in this cost analysis are located within the northern high-latitude regions.
The potential erosion control measures and promising techniques synthesized in this study include geosynthetics, the static bay beach concept, insulation systems, and microbial applications. The potential of these emerging measures and techniques for full-scale application on northern high-latitude coasts are discussed after reviewing the available research studies on their efficacy and performances under the high-latitude conditions, especially under the existence of sea ice and permafrost. Integrations of these potential measures and techniques with conventional measures are recommended and possible combinations are presented. We also propose to use a combined assessment (i.e. life cycle cost analysis and life cycle assessment) that incorporates both environmental and socio-economic impacts for optimal measure selections. This study shows that a wide knowledge gap still exists in the field application of the new measures and techniques in northern high-latitude regions even though some of them have already been widely implemented in mid- to low-latitude regions. Through the synthesis of the research gaps and challenges, future research can be directed towards upscaling of the emerging erosion control measures and techniques in northern high-latitude coastal regions.
Acknowledgments
This work was supported by the National Science Foundation under Grant Nos. OPP-1745369, OISE-1927137 and OISE-1927553. Any recommendations or conclusions are those of the authors and do not necessarily reflect the views of the US Government. The mention of trade names or commercial products does not in any way constitute an endorsement or recommendation for use. The authors would like to thank the six anonymous referees for their significant comments and constructive suggestions.
Data availability statement
The data that support the findings of this study are available from the corresponding author upon reasonable request.
Supplementary Data (361 KB, PDF)
Advertisement
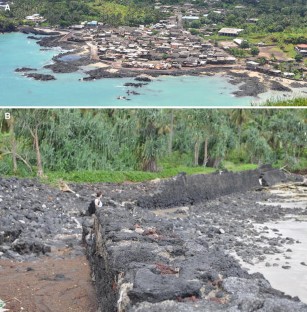
Seawalls as a response to coastal erosion and flooding: a case study from Grande Comore, Comoros (West Indian Ocean)
- Original Article
- Published: 14 September 2016
- Volume 17 , pages 1077–1087, ( 2017 )
Cite this article
- Carola Betzold ORCID: orcid.org/0000-0003-2987-7570 1 &
- Ibrahim Mohamed 2
2919 Accesses
50 Citations
2 Altmetric
Explore all metrics
Many coasts are eroding. In the Comoros, as in many other small island developing states (SIDS), communities frequently respond to coastal erosion by building seawalls—yet seawalls and other coastal defence structure are controversial, especially in a SIDS context, where they typically are poorly designed and constructed and thus tend to increase rather decrease erosion and are often unable to prevent flooding. Through an exploratory qualitative case study of Grande Comore, the main island of the Comoros (West Indian Ocean), we compare and contrast how local stakeholders, national elites and donors understand coastal erosion and flooding in the context of a changing climate and how they experience and perceive seawalls as a response measure. Our analysis suggests that although stakeholders are aware of different drivers of coastal erosion and flooding, including sand mining, seawalls are a frequent and customary response to coastal erosion and flooding. Little is known about their disadvantages or alternative response measures, especially among local community members. Further, a lack of capacity and resources leads not only to poorly designed and constructed seawalls but also to difficulties in enforcing rules and regulations such as bans on sand mining. From our exploratory study, three conclusions emerge: (1) local drivers of coastal erosion and flooding are more visible than global climate change while funding is more readily available for adaptation to climate change; (2) a mix of context and site-specific measures would be needed to adequately respond to coastal erosion and flooding; and (3) further information and knowledge about the extent and causes of coastal erosion and flooding as well as about the effects of different response measures would be needed to allow such context and site-specific measures.
This is a preview of subscription content, log in via an institution to check access.
Access this article
Price includes VAT (Russian Federation)
Instant access to the full article PDF.
Rent this article via DeepDyve
Institutional subscriptions
Source : Wikimedia, https://commons.wikimedia.org/wiki/File:Grande_Comore_topographic_map-fr.svg
All interviews were conducted in French. The translations here are by the authors.
Abdou Rabi F, Ali B (n.d.) Bilan sur l’extraction du sable en Grande Comore. Programme régional environment COI/UE Coordination des Comores. http://www.commissionoceanindien.org/archives/environment.ioconline.org/Bilan_extraction_sable_-_Grande_Comore_140124_011400ff7c.zip?eID=tx_mm_bccmsbase_zip&id=101886189852e02c0ce8182 . Accessed 10 April 2016
ASCLME (2012) National Marine Ecosystem Diagnostic Analysis. Contribution to the Agulhas and Somali Current Large Marine Ecosystems Project (supported by UNDP with GEF grant financing), Comoros
Bird ECF (1985) Coastline changes: a global review. Wiley, New York
Google Scholar
Cazenave A, Cozannet GL (2014) Sea level rise and its coastal impacts. Earth’s Future 2:15–34. doi: 10.1002/2013EF000188
Article Google Scholar
Cooper JAG, McKenna J (2008) Working with natural processes: the challenge for coastal protection strategies. Geogr J 174:315–331. doi: 10.1111/j.1475-4959.2008.00302.x
Cooper JAG, Pile J (2014) The adaptation-resistance spectrum: a classification of contemporary adaptation approaches to climate-related coastal change. Ocean Coast Manage 94:90–98. doi: 10.1016/j.ocecoaman.2013.09.006
Cooper JAG, Pilkey OH (eds) (2012) Pitfalls of shoreline stabilization: selected case studies, vol 3. Coastal Research Library. Springer, Dordrecht
David G, Dumas P, Lancelot L, Sabinot C, Sinane K (2014) Quand la mer fait le mur. In: Paper presented at coastal risks: hazards, issues, representations, management, 3–4 July, Brest
De Comarmond A, Payet R (2010) Small island developing states: incubators of innovative adaptation and sustainable technologies? In: Michel D, Pandya A (eds) Coastal zones and climate change. The Henry L. Stimson Center, Washington, pp 51–68
Defeo O, McLachlan A, Schoeman DS, Schlacher TA, Dugan J, Jones A, Lastra M, Scapini F (2009) Threats to sandy beach ecosystems: a review. Estuar Coast Shelf Sci 81:1–12. doi: 10.1016/j.ecss.2008.09.022
Donner SD, Webber S (2014) Obstacles to climate change adaptation decisions: a case study of sea-level rise and coastal protection measures in Kiribati. Sustain Sci 9:331–345. doi: 10.1007/s11625-014-0242-z
Dugan JE, Hubbard DM, Rodil IF, Revell DL, Schroeter S (2008) Ecological effects of coastal armoring on sandy beaches. Mar Ecol 29:160–170. doi: 10.1111/j.1439-0485.2008.00231.x
Duvat V (2009) Beach erosion management in small island developing states: Indian Ocean Case Studies. In: Brebbia CA, Benassai G, Rodriguez GR (eds) Proceedings of the 1st international conference on physical coastal processes, management and engineering, Malta, 2009. WIT Transactions on Ecology and the Environment. WIT Press, Southhampton, pp 149–160. doi: 10.2495/CP090141
Duvat V (2013) Coastal protection structures in Tarawa Atoll, Republic of Kiribati. Sustain Sci 8:363–379. doi: 10.1007/s11625-013-0205-9
Forbes DL, James TS, Sutherland M, Nichols SE (2013) Physical basis of coastal adaptation on tropical small islands. Sustain Sci 8:327–344. doi: 10.1007/s11625-013-0218-4
French PW (2001) Coastal defences: processes, problems and solutions. Routledge, London
Book Google Scholar
Gillie RD (1997) Causes of Coastal Erosion in Pacific Island Nations. J Coast Res 24:173–204
Jackson CW Jr, Bush DM, Neal WJ (2012) Documenting beach loss in front of seawalls in Puerto Rico: Pitfalls of Engineering a Small Island Nation Shore. In: Cooper JAG, Pilkey OH (eds) Pitfalls of shoreline stabilization: selected case studies. Springer, Dordrecht, pp 53–71
Chapter Google Scholar
Kench P (2010) Coastal monitoring, Reef Island Shoreline Dynamics and Management Implications. Final Report. Prepared for Environment Protection Agency Ministry of Housing, Transport and Environment, Government of the Maldives. http://www.environment.gov.mv/v1/download/288 . Accessed 18 May 2015
Kench P (2012) Compromising Reef Island shoreline dynamics: legacies of the engineering paradigm in the Maldives. In: Cooper JAG, Pilkey OH (eds) Pitfalls of shoreline stabilization: selected case studies. Springer, Dordrecht, pp 165–186
Kraus NC (1988) The effects of seawalls on the beach: an extended literature review. J Coast Res 4:1–29
Kraus NC, McDougal WG (1996) The effects of seawalls on the beach: part I, an updated literature review. J Coast Res 12:691–701
Martinez G, Bizikova L, Blobel D, Swart R (2011) Emerging climate change coastal adaptation strategies and case studies around the world. In: Schernewski G, Hofstede J, Neumann T (eds) Global change and baltic coastal zones. Springer, Dordrecht, pp 249–273
McSweeney C, New MGL (2008) UNDP climate change country profiles. Comoros. http://country-profiles.geog.ox.ac.uk/ . Accessed 17 Nov 2015
Michel D, Pandya A (eds) (2010) Coastal zones and climate change. The Henry L. Stimson Center, Washington
Mimura N, Nunn P (1998) Trends of beach erosion and shoreline protection in rural Fiji. J Coast Res 14:37–46
Monnereau I, Abraham S (2013) Limits to autonomous adaptation in response to coastal erosion in Kosrae, Micronesia. Int J Global Warning 5:416–432. doi: 10.1504/IJGW.2013.057283
Montfraix B (2011) Etude de vulnerabilité aux changements climatiques: Evaluation qualitative. Indian Ocean Commission, Quatre Bornes, Mauritius
Mycoo MA, Chadwick A (2012) Adaptation to climate change: the coastal zone of Barbados. Marit Eng 165:159–168. doi: 10.1680/maen.2011.19
Nordstrom KF (2014) Living with shore protection structures: a review. Estuar Coast Shelf Sci 150:11–23. doi: 10.1016/j.ecss.2013.11.003
Nunn PD (2004) Understanding and adapting to sea-level change. In: Harris F (ed) Global environmental issues. Wiley, Chichester, pp 45–64
Nunn PD (2007) Adapting to climate change in the Pacific Islands. Kagoshima University Research Center for the Pacific Islands. Occas Paper 47:29–40
Nunn PD (2009) Responding to the challenges of climate change in the Pacific Islands: management and technological imperatives. Clim Res 40:211–231. doi: 10.3354/cr00806
Nunn PD (2010) Bridging the gulf between science and society: imperatives for minimizing societal disruption from climate change in the Pacific. In: Sumi A, Fukushi K, Hiramatsu A (eds) Adaptation and mitigation strategies for climate change. Springer Japan, Tokyo, pp 233–248
Nunn PD (2013) The end of the Pacific? Effects of sea level rise on Pacific Island Livelihoods. Singapore J Trop Geo 34:143–171. doi: 10.1111/sjtg.12021
Nurse LA, McLean RF, Agard J, Briguglio LP, Duvat-Magnan V, Pelesikoti N,Tompkins E, Webb A (2014) Small Islands. In: Barros VR, Field CB, Dokken DJ, Mastrandrea MD, Mach KJ, Bilir TE, Chatterjee M, Ebi KL, Estrada YO, Genova RC, Girma B, Kissel ES, Levy AN, MacCracken S, Mastrandrea PR, White LL (eds) Climate change 2014: impacts, adaptation, and vulnerability. Part B: regional aspects. Contribution of working group II to the fifth assessment report of the intergovernmental panel on climate change. Cambridge University Press, Cambridge, pp 1613–1654
Sinane K (2013) Les littoraux des Comores, dynamique d’un système anthropisé: le cas de l’île d’Anjouan. Dissertation, Université de La Réunion
Sinane K, David G, Pennober G, Troadec R (2010) Fragilisation et modification des formation littorales sur l’île d’Anjouan (Comores): Quand l’érosion d’origine anthropique se conjugue au changement climatique. VertigO—rev électron en sci de l’environ. doi: 10.4000/vertigo.10528
Sovacool BK (2012) Perceptions of climate change risks and resilient island planning in the Maldives. Mitig Adapt Strateg Glob Change 17:731–752. doi: 10.1007/s11027-011-9341-7
UNFCCC (2009) Copenhagen Accord. Document number FCCC/CP/2009/11/Add.1
Union of the Comoros (2006) National action programme of adaptation to climate change (NAPA). Ministry of Rural Development, Fisheries, Handicraft and Environment, Moroni
Union of the Comoros (2012) Seconde Communication Nationale sur les Changements Climatiques. Vice-Presidency in charge of the Ministry of Production, Environment, Energy, Industry and Handicraft, Moroni
Webber S (2013) Performative vulnerability: climate change adaptation policies and financing in Kiribati. Environ Plan A 45:2717–2733. doi: 10.1068/a45311
Weir T, Dovey L, Orcherton D (2016) Social and cultural issues raised by climate change in Pacific Island Countries: an overview. Reg Environ Change. doi: 10.1007/s10113-016-1012-5
Wong PP, Losada IJ, Gattuso J-P, Hinkel J, Khattabi A, McInnes K, Saito Y, Sallenger A (2014) Coastal systems and low-lying areas. In: Field CB, Barros VR, Dokken DJ, Mach KJ, Mastrandrea MD, Bilir TE, Chatterjee M, Ebi KL, Estrada YO, Genova RC, Girma B, Kissel ES, Levy AN, MacCracken S, Mastrandrea PR, White LL (eds) Climate change 2014: impacts, adaptation and vulnerability. Part A: global and sectoral aspects. Contribution of working group II to the fifth assessment report of the intergovernmnetal panel on climate change. Cambridge University Press, Cambridge
Worliczek E, Allenbach M, Mückler H (2010) Climate change and the acceptance of coastal sand mining on Wallis Island. Unpublished manuscript. http://www.academia.edu/249171/Climate_Change_and_the_acceptance_of_coastal_sand_mining_on_Wallis_Island . Accessed 16 June 2016
Download references
Acknowledgments
We would like to thank the many people that have contributed to this project, in particular Dr. Kamardine Sinane, Hamid Soulé, the staff and interns at the Herbier des Comores, the student research assistants, and of course all our interview partners and survey respondents for sharing their views with us. We would also like to thank the editors of the special issue as well as two anonymous reviewers for comments on previous versions of this paper. We also gratefully acknowledge financial support from the Gothenburg Centre for Globalisation and Development. We thank the special issue editors for this point. We thank the special issue editors for pointing out these common design shortcomings.
Author information
Authors and affiliations.
Institute of Development Policy and Management, University of Antwerp, Lange Sint-Anna Straat 7, 2000, Antwerp, Belgium
Carola Betzold
Département de Géographie, University of the Comoros, Moroni, Comoros
Ibrahim Mohamed
You can also search for this author in PubMed Google Scholar
Corresponding author
Correspondence to Carola Betzold .
Electronic supplementary material
Below is the link to the electronic supplementary material.
Supplementary material 1 (DOCX 114 kb)
Rights and permissions.
Reprints and permissions
About this article
Betzold, C., Mohamed, I. Seawalls as a response to coastal erosion and flooding: a case study from Grande Comore, Comoros (West Indian Ocean). Reg Environ Change 17 , 1077–1087 (2017). https://doi.org/10.1007/s10113-016-1044-x
Download citation
Received : 29 November 2015
Accepted : 13 August 2016
Published : 14 September 2016
Issue Date : April 2017
DOI : https://doi.org/10.1007/s10113-016-1044-x
Share this article
Anyone you share the following link with will be able to read this content:
Sorry, a shareable link is not currently available for this article.
Provided by the Springer Nature SharedIt content-sharing initiative
- Grande Comore
- Coastal erosion
- Climate change adaptation
- Find a journal
- Publish with us
- Track your research
Thank you for visiting nature.com. You are using a browser version with limited support for CSS. To obtain the best experience, we recommend you use a more up to date browser (or turn off compatibility mode in Internet Explorer). In the meantime, to ensure continued support, we are displaying the site without styles and JavaScript.
- View all journals
- My Account Login
- Explore content
- About the journal
- Publish with us
- Sign up for alerts
- Open access
- Published: 01 March 2024
Climate threats to coastal infrastructure and sustainable development outcomes
- Daniel Adshead ORCID: orcid.org/0000-0002-0829-925X 1 , 2 ,
- Amelie Paszkowski ORCID: orcid.org/0000-0002-3199-0858 2 ,
- Sarah S. Gall ORCID: orcid.org/0000-0003-4676-4519 2 ,
- Alison M. Peard ORCID: orcid.org/0000-0003-3054-2612 2 ,
- Mohammed Sarfaraz Gani Adnan ORCID: orcid.org/0000-0002-7276-1891 3 , 4 ,
- Jasper Verschuur ORCID: orcid.org/0000-0002-5277-4353 2 &
- Jim W. Hall ORCID: orcid.org/0000-0002-2024-9191 2
Nature Climate Change ( 2024 ) Cite this article
4884 Accesses
26 Altmetric
Metrics details
- Climate-change adaptation
- Climate-change impacts
- Developing world
- Environmental impact
An Author Correction to this article was published on 11 March 2024
This article has been updated
Climate hazards pose increasing threats to development outcomes across the world’s coastal regions by impacting infrastructure service delivery. Using a high-resolution dataset of 8.2 million households in Bangladesh’s coastal zone, we assess the extent to which infrastructure service disruptions induced by flood, cyclone and erosion hazards can thwart progress towards the Sustainable Development Goals (SDGs). Results show that climate hazards potentially threaten infrastructure service access to all households, with the poorest being disproportionately threatened in 69% of coastal subdistricts. Targeting adaptation to these climatic threats in one-third (33%) of the most vulnerable areas could help to safeguard 50–85% of achieved progress towards SDG 3, 4, 7, 8 and 13 indicators. These findings illustrate the potential of geospatial climate risk analyses, which incorporate direct household exposure and essential service access. Such high-resolution analyses are becoming feasible even in data-scarce parts of the world, helping decision-makers target and prioritize pro-poor development.
Future socioeconomic development along the West African coast forms a larger hazard than sea level rise
Olusegun A. Dada, Rafael Almar, … Philip S. J. Minderhoud

Adaptation constraints in scenarios of socio-economic development
Emily Theokritoff, Nicole van Maanen, … Carl-Friedrich Schleussner

Unprecedented droughts are expected to exacerbate urban inequalities in Southern Africa
Maria Rusca, Elisa Savelli, … Gabriele Messori
Climate hazards are projected to have a disproportionate impact on poor and vulnerable people and communities 1 . This is a consequence, among others, of poorer people living in more exposed locations (‘exposure bias’) 2 , 3 . The exposure and vulnerability of poor communities can become exacerbated over time through cycles of repeated climate impacts 4 , 5 , which can prevent the accumulation of assets and chronically impact health, education and employment opportunities, and drive temporary or permanent out-migration of people and their resources. This type of ‘poverty trap’ may lead to chronic declines in welfare at a range of scales, which has been documented across regions 6 , 7 , 8 including in coastal Bangladesh 9 , which is on the ‘frontline’ of climate change and its associated effects—the focus area of this study.
Given the potential for climate extremes to adversely impact people and their wider development opportunities, national development plans may be thrown off course by climate impacts 10 , 11 . Targeted interventions focused on the most vulnerable can help to alleviate these harmful dynamics. However, given inevitably scarce resources and the potential for misallocation, these interventions need to be informed by spatial analyses on climate risks and vulnerabilities, as well as their interactions across socioeconomic systems 12 , 13 , 14 . Thus far, however, the linking of high-resolution spatial vulnerability mapping with hazard, exposure and sustainable development objectives is incomplete.
Social vulnerability has been mapped geospatially and integrated with flood risk management assessment at the local and municipal scales 15 , 16 , as well as at the national and global scales 1 . However, the impacts of climate hazards, especially flooding, erosion and other geomorphological changes, can (1) be sensitive to the exact location of vulnerable households, requiring high-resolution geolocated household-level data; and (2) depend not only on households’ locations but also on their access to essential services, such as hospitals and electricity, which are fundamental to the achievement of the Sustainable Development Goals (SDGs). Currently, there is a lack of reliable high-resolution data to distinguish local and regional vulnerability differences 17 , 18 . This lack of detailed information can explain the discrepancies in estimates of climate risks, for example, in river floodplains 19 and coastal zones 20 , which can undermine efforts to target adaptation towards the most vulnerable.
The SDGs endeavour to provide a complete and universally applicable assessment framework for development progress. Several studies have examined at an aggregated scale how cross-cutting development interventions (for example, in infrastructure systems, green energy, climate action and other areas 21 , 22 , 23 ) can contribute to several SDGs. It is also recognized that appropriate and measurable indicators are needed to drive more-targeted development planning and adaptation strategies within the SDG framework 24 , 25 , 26 . Recent national-scale applications of such approaches demonstrate how resilience needs can be identified across a nation’s built and natural assets, and how strategic interventions can be evaluated in relation to a national development vision informed by the SDGs 27 , 28 , 29 .
Local risks to development progress in coastal Bangladesh
Here we illustrate how geolocated household data can be used in data-scarce locations to obtain new insights about climatic threats to sustainable development. We assess these vulnerabilities through the lens of infrastructure service delivery and its role in achieving the SDGs in coastal Bangladesh 30 . Bangladesh is situated in a global hotspot of climate hazards, with more than 80% of its land area consisting of floodplain lands 31 . Frequent and intense fluvial, pluvial and tidal flooding, cyclonic winds and associated storm surges, and widespread riverbank and coastal erosion impact the country on an annual basis 32 , 33 , 34 . The repeated damages and disruptions to infrastructure networks as a result of these multiple hazards place a heavy burden on the country’s economic growth, social resilience and progress towards achieving the SDGs 35 . In coastal Bangladesh, particularly in rural areas, inadequate infrastructure services hamper human development and slow down resilience efforts in the face of hazard impacts 36 . However, the understanding of household-level infrastructure service disruption resulting from the threats of climatic hazards remains limited, with previous efforts mainly focusing on constructing risk 37 and resilience metrics to assess hazard threats to infrastructure. In Bangladesh, the SDG Working Committee of the Prime Minister’s Office, supported by all relevant government ministries, has defined 39 priority indicators (NPTs) to measure progress towards key SDG targets ( https://sdg.gov.bd/ ), which have informed the geospatial analysis in this study. Directly addressing five of these indicators, we bring together national-scale geospatial data on climate hazards and infrastructure assets with high-resolution household data to assess localized risks to SDG achievement by means of disruptions to infrastructure service provision caused by one or multiple climate hazards (see Methods ). Notably, we assess household access to these essential services, quantifying not only the exposure of households but also potential disruption to services upon which they depend.
We first assess the exposure of coastal Bangladesh’s infrastructure service provision to climate hazards by intersecting river and coastal flooding, cyclone and erosion hazard maps (for the present day, as well as for future scenarios of river and coastal flooding) with critical infrastructure asset and network data relevant to subsequent assessments of SDG attainment (Fig. 1 , top left and right; see Methods ). The exposure analysis makes use of a synthetic household dataset that associates realistic socioeconomic household characteristics (such as electrification, employment and educational achievement) with the location of households (for example, using population density maps), which have been validated by independent household surveys 38 . Further survey data and geospatial analysis is used to develop a spatial proxy of socioeconomic household ‘wealth’ groups (which are divided into quintiles; see Methods ) and their levels of infrastructure access in the coastal zone of Bangladesh. We analyse the whole coastal region of Bangladesh (150 subdistricts, locally termed as ‘upazilas’, across 19 coastal districts, with a total population of ~35 million people 39 ) and assess infrastructure service delivery for individual households, developing climate risk profiles that quantify the extent of household exposure to multiple hazards (Fig. 1 , bottom left).

Key climate hazards (top left) are intersected with critical infrastructure asset and network data (top right). Climate risk profiles quantifying the extent of potential household disruption of various infrastructure services are determined at the upazila scale (local subdistrict) (bottom left). Household-level socioeconomic data are used to assess current development progress and future impacts of climate threats on the government’s priority SDG indicators (bottom right).
Woven throughout this process is Bangladesh’s sustainable development vision. We downscale current performance against relevant national targets to the local (upazila) level and utilize household-level data on socioeconomic characteristics and access to services to reveal the spatial landscape of current progress towards the selected targets (Fig. 1 , bottom right). By linking asset service delivery at the household level and their exposure to various hazard scenarios, we can assess the potential impacts of hazards on SDG progress in relation to some of the government’s overall development targets.
Household service ‘exposure bias’ to climate hazards
This analysis focuses on the disruption to cyclone shelters, education facilities, market centres, healthcare facilities and electricity substations, selected for their relevance to the subsequent analysis on SDG target achievement (Supplementary Fig. 1 also includes the road network). For coastal and riverine flooding, we consider a household disrupted if its nearest asset is exposed to more than 1 m of flooding (see Methods ). All 8.2 million households in the coastal region of Bangladesh are exposed to some disruption of essential infrastructure services caused by climate hazards. For a baseline 1-in-50-year hazard, coastal flooding (including storm surges), riverine flooding and cyclones (wind damage) are expected to disrupt on average 39.5%, 22.7% and 94.5%, respectively, of the coastal population across all infrastructure services. Erosion is estimated to have disrupted 56% of the coastal population across all infrastructure services cumulatively since 1987. It is important to note that these climate hazards (for example, cyclonic winds and floods) can occur simultaneously, leading to more severe compound impacts, which are not considered in this study.
For combinations of each hazard and asset type, we calculate the proportion of households in each upazila and wealth quintile exposed to potential disruptions to services in the event of a 1-in-50-year hazard for a present-day scenario and in the case of flooding for the year 2030 under Representative Concentration Pathway (RCP) 4.5. Figure 2 displays coastal flooding exposure for the 1-in-50-year event for 2030 (RCP 4.5), showing the expected proportion of households disrupted in the median socioeconomic quintile (left), and the statistically significant poverty bias (middle) and wealth bias (right) relative to this median quintile. As evident, the main effects of coastal flooding are concentrated in the low-lying Khulna and Barisal divisions and in the coastal southern half of the Chittagong division. The prevalence of coastal flooding in the southern part of Chittagong reflects the strong winds and waves in this region, both with south westerly directions 40 , 41 which pushes water directly onshore.

For each of the five infrastructure service types, the panels show the spatial distribution of service exposure to a 1-in-50-year coastal flood event under a 2030 RCP 4.5 scenario in terms of proportion of households affected per upazila (see Supplementary Fig. 1 for equivalent results for other hazards, including the road network). The left panel shows the proportion of households in the median wealth quintile exposed to coastal flooding through service disruption. The centre and right panels show the relative risk (risk ratio) of household exposure for the poorer (centre) and wealthier (right) quintiles relative to the median quintile. Relative risks are only shown for upazilas where the difference between exposure proportions between quintiles was found to be statistically significant at the 95% confidence level.
Across the entire coastal region, a mild but consistent pattern shows that poor households are more exposed to infrastructure service disruptions from coastal flooding than wealthier socioeconomic groups. For cyclone shelters, market centres, education and health facilities, we see a statistically significant poverty bias. In the case of education facilities, the poor population is 1.07 times and 1.13 times more likely to be exposed to education disruption than the median or wealthiest groups, respectively. We see similar risk ratios for health facilities (1.07), market centres (1.02) and cyclone shelters (1.24) between the poorest and wealthiest population groups. In the case of substations, however, this risk ratio is 0.989, indicating that the wealthiest group is 1.01 times more likely to be affected by disruption to electricity substations due to coastal flooding. This wealth bias is probably due to substations in the Patiya and Hathazari upazilas in the Chittagong division being particularly exposed to flooding near the Karnaphuli river, which predominantly serve wealthier households (60–70%) (Supplementary Fig. 1e ).
When assessing exposure to any climate hazard disrupting any infrastructure service, a statistically significant poverty bias is observed in 104 upazilas, equivalent to 69% of the coastal region of Bangladesh. Focusing on coastal flooding alone, a poverty bias in disruptions affecting at least one of the five asset types is observed in 35 (23.33%) of the 150 coastal upazilas. Twelve and two upazilas respectively exhibit poverty bias for two or three asset types. The upazilas showing poverty bias across three asset types are Chakaria (southeast Chittagong) and Jhalokati Sadar (northwest Barisal), showing poverty bias for education and market centres, as well as cyclone shelters (Chakaria) and health facilities (Jhalokati Sadar). Across the five infrastructure asset types, disruptions to education facilities show the most widespread poverty bias, with 17 upazilas largely centred in low-lying regions around the Meghna River but also in the Khulna and Chittagong divisions showing poverty biases between 1.008 (Bhandaria) and 1.4 (Kotwali). It is in these critical upazilas where most action is needed to strengthen the service that existing infrastructure systems provide, as well as where the connectivity and accessibility to improved services must be most urgently enhanced to withstand future coastal flood events. The largest absolute number of poorer households expected to be disrupted in any upazila (wealth quintiles 1–3) is in Patuakhali Sadar, where 381,680 households are exposed to substation disruptions due to coastal flooding.
Safeguarding SDG target achievement
Next, we consider the SDG progress that has been achieved across several of Bangladesh’s national priority indicators and how infrastructure service disruption as a result of climatic hazards may negatively affect it. Using household-level data, we can estimate current SDG achievement at the local level for five indicators directly linked to infrastructure services provided to households for each of the sectors included in this study (see ‘Household infrastructure service accessibility and the SDGs’ in Methods ). In the absence of appropriate resilience measures, areas that currently have higher levels of SDG achievement are at greater risk of declines in this progress due to hazard impacts on infrastructure services. Areas with lower levels of SDG progress also benefit from an understanding of the spatial nature of hazard exposure in relation to local populations lacking appropriate infrastructure services.
SDG target achievement ‘at risk’ is shown in Fig. 3 , with darker-shaded upazilas facing more potential disruption to achieved SDG progress due to the hazard. Coastal flooding has the greatest potential disruptive impact on SDG 7 (electrification) progress (as the dominant hazard in 51 upazilas), with river flooding particularly impacting SDGs 3 (health) and 4 (education) (dominant in 41 and 40 upazilas, respectively). Erosion hazards impact especially SDG 3 (dominant in 55 upazilas). Potential cyclone disruption to infrastructure services is particularly widespread across the region, showing impacts on health (SDG 3), education (SDG 4), electrification (SDG 7) and economic (SDG 8) indicators in most upazilas. While shelters are built to withstand cyclonic wind gusts, they are also exposed to coastal flooding and erosion hazards; thus, SDG 13 (limiting climate change impacts) progress remains particularly vulnerable throughout many upazilas bordering the coast. Outcomes related to household electrification, health and school access are exposed to varying levels of risk to coastal and river flooding and erosion, depending on the local SDG performance already achieved.

Darker shades indicate greater levels of SDG achievement at risk. The cumulative column (far right) shows the dominant hazard most affecting the representative SDG indicator in each upazila. The cumulative row (bottom) denotes the SDG most threatened by each type of hazard, based on its current progress level and magnitude of potential exposure to the hazard. Note: cyclone shelters are purpose-built to withstand cyclone winds, hence their exposure to cyclones is not considered a threat to progress towards the SDG 13 indicator (directly affected persons); they are, however, considered vulnerable to impacts of coastal and river flooding and erosion.
Figure 4 illustrates that policymakers aiming to prioritize resilience measures can begin to see notable impacts when focusing on only a few key areas, although these vary according to the hazard. For each of the four hazards, upazilas are ranked in descending order by their average SDG progress at risk across each of the five targets assessed here. SDG progress at risk refers to the extent to which regional target achievement would decline if hazards were to disrupt infrastructure services. For coastal flood hazards, measures to enhance the resilience of infrastructure services could safeguard 15–20% of SDG progress when only 10 upazilas (6.6% of the coastal region) are targeted, depending on the SDG; when 50 upazilas (33%) are targeted, this SDG safeguarding rises to approximately two-thirds (60–70%). In 117 upazilas (78%), over 99% of current progress across all targets can be protected. Without such safeguards, measured SDG progress in the region could see a substantial decline due to infrastructure service exposure to climatic hazards.

Top: progress towards safeguarding current SDG achievement from coastal flooding. Bottom: progress towards safeguarding current SDG achievement from river flooding, cyclones and erosion hazards. For the bottom panels, labels for the x and y axes are the same as those of the top panel. Upazilas are ranked along the horizontal axis according to their SDG progress at risk in descending order. The vertical axis shows the additional benefit, in terms of average SDG progress in the region, of resilience measures to protect hazard-exposed infrastructure service provision in each additional upazila across the five subsectors considered in these results. Each upazila’s contributions to overall (regional) SDG progress has been weighted by population. By targeting a limited number of upazilas along the x axis, policymakers can expect to see a disproportionately positive improvement in SDG progress, depending on the specific indicator and climate hazard considered. As we do not factor in resilience measures that may already have been implemented, this quantification of SDG progress at risk is based on a worst-case scenario where all exposed assets are considered to cause household disruptions.
For river flooding, corresponding numbers are 21–30% (10 upazilas) and 76–85% (50 upazilas), while 99% is achieved with resilience measures in 114 upazilas. Cyclone resilience across the relevant infrastructures safeguards 15–19% of SDG progress (10 upazilas) and 50–56% (50 upazilas), while nearly all (149) require some intervention to achieve 99% protection. Coastal erosion resilience can safeguard 19–21% (10 upazilas), 52–60% (50 upazilas) and 99% with measures in 141 upazilas. We also note differences in cumulative protection between infrastructure types due to spatial variations in hazard exposure. Electricity access (SDG 7), for example, requires more widespread resilience planning to protect against coastal flooding than against river flooding, which is more spatially limited in its potential disruption of substations.
To fully achieve the government’s SDG targets, new infrastructure will also have to be built across the coastal region and the rest of Bangladesh to reach populations that are underserved, not connected or unable to benefit from infrastructure services due to a lack of proximity. Estimates from our household dataset suggest that the share of these households can be substantial in the coastal region, reflected in survey responses and/or with households geolocated outside the distance thresholds required to reasonably access services from the nearest asset. For example, 46% of households report no access to electricity across the region, while 18% are further than 5 km from their nearest healthcare facility. Aggregating household access rates across the 150 upazilas, we observe locations across the region where resilient new infrastructure should be targeted to reach these underserved populations.
Although this infrastructure is yet to be built, intersecting these areas with high-resolution spatial hazard data can inform the spatial planning of assets to achieve national SDG priorities (shown for coastal flooding hazards in Fig. 5 ). Notably, we can visualize where these new infrastructures will be less at-risk (darker grey) and where resilience measures should be prioritized (darker blue) to ensure effective service delivery from the built asset to households. In the case of cyclone shelters, this also indicates that cyclone and associated coastal flood exposure extend into parts of the region where fewer shelters are recorded. For all other infrastructure service provision, low accessibility intersects with high exposure in the Meghna Estuary and the south-western upazilas of coastal Bangladesh.

Intersecting coastal flood hazard exposure (30 × 30 m resolution) with existing infrastructure service access, determined by household survey responses or proximity thresholds aggregated by upazila. Dark blue areas show where infrastructure access is low and hazard exposure is high (that is, the critical areas), while white areas show where both infrastructure access and hazard exposure are of less critical concern. Dark shades of grey indicate where households have low levels of access to infrastructure services but are not highly exposed to coastal flooding and light blue areas indicate where there is high exposure to coastal flooding but household access to services is high. The Sundarbans Reserve Forest is shown in green. Equivalent maps for river flooding, cyclones and erosion are included in Supplementary Fig. 2 .
Sustainable development achievement in coastal Bangladesh
Patterns of exposure to climate hazards in coastal Bangladesh are complex, but by using high-resolution geospatial analysis, we can begin to identify where poorer households’ access to essential services is disproportionately impacted by climate-related hazards. The tendency for poorer households to be more exposed in parts of coastal Bangladesh reflects several interacting factors, including typically highly resource-dependent livelihoods, insecure land ownership and an uneven distribution of accessibility to land, less capacity to migrate to cities where incomes are on average higher, land degradation linked to previous hazards and a lack of protective infrastructure, among others 42 , 43 . For instance, gradual increases in soil salinity and/or chronic waterlogging have impacted agricultural production, damaging the livelihoods of the marginal coastal population 44 . A limited capacity to relocate may reinforce this continued exposure to a greater intensity of climate hazards, which continues to pose challenges for development. In addition, disparities in the provision of infrastructure services across more and less exposed areas in this region during different phases of climate extremes—before, during and after such events—act as impediments to the resilience of coastal communities 36 .
Where national resources are limited, the results presented in this study provide means for investment prioritization, extending previous methodological development for infrastructure prioritization based on similar but less extensive household data in the same region 45 . For instance, our results indicate that market centres’ exposure to coastal flooding, cyclones and erosion may be an obstacle to achieving SDG 8 and would be further exacerbated by disruptions to the road network. Improving access to market centres by constructing new roads or enhancing existing ones could promote economic activity in the coastal region and lessen poverty 46 . In addition, purpose-built cyclone shelters are highly important to larger areas of the coastal region and should be located within short distances to settlements to be effective. We have quantitatively shown that the programme of constructing cyclone shelters has been targeting the poorest and most disadvantaged populations, and accordingly is widely regarded for its effectiveness in reducing cyclone fatalities 47 . It is important to note, however, that the results presented in this study should be interpreted with care since local realities are highly nuanced. Different infrastructure assets may be able to withstand differing levels of hazard exposure, while disruption magnitude may be caused by various structural factors and may reverberate further along the network than the local area. New and evolving resilience metrics and risk mitigation approaches for different types of infrastructure, such as roads 48 , electricity grids 49 and water supply 50 , can inform solutions and investments at the local scale.
To address the identified exposure biases, a range of resilience measures targeted to the unique characteristics of local populations should be developed and planned at local levels. This can benefit from quantitative analyses such as these, alongside more in-depth qualitative assessments within local communities. A knowledge of existing resilience-enhancement measures at each asset, local or community level and an understanding of their ability to protect households from disruptions will complement the upazila prioritization approach used here.
High-resolution measurement of spatial SDG attainment
Typically, SDG achievement is reported nationally, with performance aggregated across a country’s diverse geographical and socioeconomic strata. Mechanisms for SDG target-setting can often be vague and not amenable to downscaling at the local level 51 . This study demonstrates the future potential of bottom-up measurement of SDG progress that can be directly linked to climate hazards to assess and improve upon key sustainable development indicators.
In this and other contexts, additional SDG targets can be incorporated in the same way with adequate provision of geospatial data on other relevant infrastructures, extending to water treatment plants, distribution networks and access points (for example, wells and boreholes) (SDG 6), road and rail networks (SDGs 9 and 11), waste treatment facilities (SDG 12), and civil and government buildings (SDG 16). Climate-related hazards that are more relevant in other parts of the world (for example, droughts, wildfires and storms) can be integrated or substituted into this assessment approach, as disruptions are being measured by critical asset exposure.
Mainstreaming spatial hazard analysis into policy
There is great potential for data-driven geospatial analysis to inform adaptation investment decisions at the local level. While high-resolution household data are difficult to obtain in many contexts, emerging methods around spatial microsimulation and dasymetric modelling 52 , complemented by increasingly advanced satellite technology and remote sensing, can provide decision-makers with a precise toolkit to inform infrastructure and development decisions.
To reach its full potential in a national policy planning context however, this type of analysis must be integrated into existing government systems and processes. In the case of Bangladesh, the Mujib Climate Prosperity Plan serves as a national roadmap for climate resilience seeking to counteract climate-induced damage and losses, strengthening employment, promoting well-being and securing energy independence while supporting delivery of the 2030 Sustainable Development Agenda. A comprehensive streamlining process with identified entry points in relevant government agencies and ministries should be undertaken in parallel for this type of analysis to be most effective.
The delivery date for the Sustainable Development Goals is rapidly approaching; however, major achievement gaps remain across most countries. These gaps are at risk of growing as climate hazards intensify in many parts of the world. Existing national targets do not always adopt a pro-poor approach to achieving the SDGs or consider exposure bias in vulnerable communities. As a result, these populations are at a higher risk of failing to reach target thresholds, even as national development progress improves overall. We show that novel geospatial data techniques can assist policymakers in understanding localized climate hazard threats to the achievement of national SDG targets through their impacts on vulnerable populations. This approach is particularly relevant in other similarly data-scarce parts of the world, where decision-makers can target and prioritize pro-poor development, accelerating informed sustainable development at scale.
The study was conducted according to the following methodological components: (1) creation of a database 53 including (i) relevant climate hazard scenario data from national or global datasets and (ii) point and network data for critical infrastructure and social sector locations; (2) use of high-resolution household survey data to identify dependence on infrastructure assets at a granular scale through nearest-neighbour analysis; (3) assignment of households to wealth quintiles based on household survey responses; (4) calculation of statistically significant exposure biases across different wealth quintiles; and (5) calculation of SDG progress downscaled to the local administrative level through household survey responses and proximity to services, and identification of climate threats to progress based on asset exposure.
Spatial database of climate hazard and infrastructure risks
The study area was defined as the 19 districts comprising Bangladesh’s coastal region, which were further divided into 150 smaller administrative regions, known as upazilas, based on a recent World Bank report 39 .
Climate hazards
For coastal and riverine flooding, data from the World Resources Institute ‘Aqueduct Floods’ online platform was obtained 54 , which include both tidal inundation as well as storm-surge-induced coastal flooding. The dataset measures flood risks for the baseline year (1980) and projections to 2030, 2050 and 2080. These scenarios are provided for return periods for 2, 10, 25, 50 and 100 years for Representative Concentration Pathways (RCPs) 4.5 (realistic) and 8.5 (extreme) at a resolution of 30 arc seconds (about 1 km × 1 km). For cyclone hazards, maximum wind gusts (in m s −1 ) are based on a probability distribution derived from ensemble resimulations of 12 historical cyclones from return period event maps at a resolution of 4.4 km 40 . For erosion hazards, an erosion map was created using the DeepWaterMap model 55 , 56 , which is based on satellite imagery from the past 35 years and has a resolution of 30 m × 30 m. The DeepWaterMap model automatically distinguishes land from water, and thus tracks morphological changes over time; ref. 55 provides further information on the model and its validation in coastal Bangladesh. Here we extract all pixels that have experienced erosion at any point in the last 35 years. Given the focus on past cyclones and erosion events, these two datasets do not entail future hazard scenarios. Although there is a discrepancy in the scenarios and timeframes covered by the different climate hazard datasets, at present there are no models that simulate cyclonic wind gusts and erosion trends for the same scenarios and timeframes as river and coastal flooding. Thus, for the purpose of this multihazard assessment, analyses were undertaken for all four hazards, but their differing temporal resolutions are caveated where appropriate. Finally, despite not undertaking an uncertainty analysis of these hazard layers, we ensured that all input data have previously been validated; for example, the cyclone hazard layer was validated using past cyclone events 40 , the erosion layer was validated in coastal Bangladesh 55 , synthetic household data were validated against household surveys 38 .
Infrastructure data
Point and network data for the energy sector as well as critical social infrastructure assets were obtained from a mix of publicly available and Bangladesh Government sources: Power Division and BPDB (electricity); Water Resources Planning Organization (WARPO) (market centres); Department of Health (healthcare facilities); Local Government Engineering Department (LGED) (cyclone shelters); and Bangladesh Bureau of Statistics (educational facilities). We gathered and verified this data through a series of workshops, dialogues and stakeholder meetings held in 2022. These events were collaboratively organized by the Department of Environment (DoE) in Bangladesh, the Global Center on Adaptation (GCA), the United Nations Office for Project Services (UNOPS), and the Center for Environmental and Geographic Information Services (CEGIS). The close collaboration with CEGIS ensured that the most up-to-date information was being collected 30 . The geospatially located critical infrastructure assessed here included 113 electricity substations, 2,062 market centres, 3,086 healthcare facilities, 3,777 cyclone shelters and 73,814 educational institutions.
Each layer of infrastructure asset and network data was then intersected with all climate hazards to determine the exposure of infrastructure service provision under each scenario, including the estimated flood depth in metres.
Infrastructure service provision to coastal households
To assess the potential impacts of infrastructure service disruptions on households in the coastal region, three categories of data were combined: climate hazards, infrastructure asset data (as described above) and household characteristics. Household-level population data were obtained from the World Bank 38 as part of a spatially explicit synthetic household dataset for the coastal region of Bangladesh, which includes unique structural and socioeconomic attributes mapped to the local level and validated by independent household surveys. This includes household-level information on, among other things, access to electricity, tap water and sanitation, housing type, literacy, education levels and employment.
We conducted a nearest-neighbour analysis to link each household to its nearest service-providing asset for each subsector, thus estimating the household profiles (characteristics) dependent on each infrastructure asset. Service area estimation can be achieved through various methods, such as accessibility mapping using the road network 57 or conducting a sample of household surveys 36 to determine actual receipt of services. Here we used a simpler radius-based approach due to several factors including: (1) road network data for the coastal region of Bangladesh being not well-connected enough to allow for routing and unavailability of up-to-date information on the quality of roads; and (2) household positions in the synthetic dataset being represented in clusters which, while geographically accurate to the local district, do not represent exact positions, leading routing to be inherently inaccurate and less interesting. This simplified approach allowed the assignment of households to assets at the scale of the entire coastal region.
Only households reporting access to the corresponding service were included, and where these could not be determined from the survey, households were considered not to have access when they fell outside of a distance threshold (5 km for health centres, 1.6 km for cyclone shelters, see section ‘Household infrastructure service accessibility and the SDGs’). Using the intersection of hazard and asset data as described above, the exposure of households was determined for each scenario on the basis of its supposed use of or connection to the nearest assigned asset. Based on in-country stakeholder feedback, the scenario chosen for this part of the analysis was a 1-in-50-year event for a time period of 2030 under RCP 4.5. This scenario was applied to the two flood hazards (coastal and fluvial flooding), while the hazards of erosion and cyclones were based on historical data with no simulations of future scenarios.
Household assignment to wealth quintiles
To estimate relative household wealth levels, we constructed a wealth index using several infrastructure access variables included in the available household dataset, in line with that created in ref. 45 for coastal Bangladesh. This approach provides a more objective proxy of household wealth than common variables such as income or consumption, which can be hard to measure accurately in low-income settings due to their variable or short-term nature, or the informal nature of much of the economy. The index was constructed separately for households identified as urban and rural due to differences in underlying variables between urban and rural dwellers (for example, electricity being more common in urban areas). Table 1 lists the variables that were used to construct the wealth index.
The data were first normalized, after which we ran a principal component analysis in line with the approach of creating a wealth index used by WFP-FAO 58 . The Kaiser–Meyer–Olkin measure of sampling adequacy showed values of 0.62 for rural dwellers and 0.71 for urban dwellers, which are above the minimum acceptable value of 0.6. The first principal component explained ~40% of the variance and was used to construct the wealth index. We separated the indexed households into quintiles, which ranged from the poorest (Q1) to the wealthiest (Q5) quintile.
Calculating statistically significant exposure bias
To explore and quantify whether there were poverty or wealth biases in the exposure of households to climate disruptions to infrastructure services, the risk ratio was calculated. This quantifies how much more likely a household in a given wealth group is to experience service disruption due to a hazard relative to the median wealth group. Such biases were then tested for statistical significance following typical hypothesis-testing procedures as outlined below. Only relative risks that were significantly different from those of the median group at the 95% confidence level were considered in this analysis.
Given two populations of size \(n\) and \(m\) with respective \({X}_{1}\) and \({X}_{0}\) households disrupted due to a climate hazard, the proportion of successes (number of households exposed to disruption in this case) is given by \({p}_{1}=\frac{{X}_{1}}{n}\) and \({p}_{0}=\frac{{X}_{0}}{m}\) . We can understand these to be samples from two binomial distributions Bin( \({p}_{1}\) , \(n\) ) and Bin( \({p}_{0}\) , \(m\) ). If the underlying probability of disruption is the same for both populations, then \({p}_{1}={p}_{0}\) . A. hypothesis test for this has the form,
The standard, normally distributed test statistic for this hypothesis test is given by,
and we used a critical \(z\) -score of ±1.96. If our test statistic \(z\) fell outside of this range, we then rejected the null hypothesis of the distributions being the same at the 95% confidence level 59 . We applied this to compare both the poorest (Q1 and Q2) and the wealthiest (Q4 and Q5) population groups to the median wealth group (Q3). Given the large number of households in each upazila (in the order of 100,000 households per upazila), the confidence intervals became quite narrow, meaning that small deviations between the poor/wealthy and median proportion of households affected could produce a statistically significant result.
Household infrastructure service accessibility and the SDGs
This section focused on protecting or ‘safeguarding’ of existing progress towards several SDG indicators by identifying where achieved target levels might be most at risk from climate hazards. The Government of Bangladesh’s SDG Working Committee has drafted prioritized national SDG targets (‘NPTs’) ( https://sdg.gov.bd/ ). First, five targets closely linked to infrastructure service delivery in the sectors addressed in this study were identified; these fell under 5 relevant SDGs (3, 4, 7, 8, 13) and related to the share of the population having access. The targets linked to the water supply and roads subsectors (SDGs 6 and 9) were omitted due to a lack of data on water supply infrastructure and local road types in the synthetic household dataset.
Next, for each of the 150 upazilas in Bangladesh’s 19 coastal districts, detailed survey data from the synthetic household dataset were aggregated to calculate current progress at the upazila level towards each target, on the basis of household responses to questions on access to education (SDG 4), electricity access (SDG 7) and employment (SDG 8). The calculated distance from each household to the nearest asset was further used to estimate access to health centres (SDG 3) and shelters (SDG 13). On the basis of previous studies, thresholds for reasonable access to health services were set at 5 km 60 , 61 , 62 , while access to shelters was set at 1.6 km 63 , 64 . The households outside these thresholds were considered to have ‘no access’.
All connected households in these upazilas were then assigned to the nearest asset within each subsector (substation, school, health centre, market centre and shelter). Households were considered exposed to hazards affecting their nearest asset if the flood exposure to the asset was >1 m (coastal and riverine flooding), if wind gusts were >30 m s −1 (cyclones) or if erosion occurred 43 . Under the following relevant climate scenarios for each of the four assessed hazards, the share of households (or population) in each upazila ‘with current access to the service’ and ‘also facing disruption due to exposure’ to a hazard, was calculated. The scenario in this analysis was based on:
A 2030 timeframe, corresponding to the delivery date of the Sustainable Development Goals.
A 50-year return period and RCP 4.5, based on consultations with local stakeholders.
This measure of ‘progress at risk’ was then calculated as a share of the total target, downscaled from the national scale to each upazila. An example is shown in Supplementary Fig. 3 . The calculations and assumptions in Supplementary Table 2 were used to assess current (upazila-level) progress towards the government’s stated SDG target for each relevant SDG.
Data availability
Data used in this study can be accessed at https://doi.org/10.5281/zenodo.10554713 .
Code availability
Code relevant to the analysis can be accessed at https://www.dropbox.com/scl/fi/tpjcxtl4j9m9ht0tl0ocq/NCLIM-23071599-code_final.zip?rlkey=ux7du7k4rkru352moob6quwwu&dl=0 .
Change history
11 march 2024.
A Correction to this paper has been published: https://doi.org/10.1038/s41558-024-01974-8
Winsemius, H. C. et al. Disaster risk, climate change, and poverty: assessing the global exposure of poor people to floods and droughts. Environ. Dev. Econ. 23 , 328–348 (2018).
Google Scholar
Hallegatte, S., Vogt-Schilb, A., Bangalore, M. & Rozenberg, J. Unbreakable: Building the Resilience of the Poor in the Face of Natura l Disasters (World Bank, 2017).
Verschuur, J., Koks, E. E., Haque, A. & Hall, J. W. Prioritising resilience policies to reduce welfare losses from natural disasters: a case study for coastal Bangladesh. Glob. Environ. Change 65 , 102179 (2020).
Borgomeo, E., Hall, J. W. & Salehin, M. Avoiding the water-poverty trap: insights from a conceptual human-water dynamical model for coastal Bangladesh. Int. J. Water Resour. Dev. 34 , 900–922 (2018).
Barbour, E. J. et al. The unequal distribution of water risks and adaptation benefits in coastal Bangladesh. Nat. Sustain. 5 , 294–302 (2022).
Carter, M. R., Little, P. D., Mogues, T. & Negatu, W. Poverty traps and natural disasters in Ethiopia and Honduras. World Dev. 35 , 835–856 (2007).
Dercon, S. & Christiaensen, L. Consumption risk, technology adoption and poverty traps: evidence from Ethiopia. J. Dev. Econ. 96 , 159–173 (2011).
Dadson, S. et al. Water security, risk, and economic growth: insights from a dynamical systems model. Water Resour. Res. 53 , 6425–6438 (2017).
ADS Google Scholar
Lázár, A. N., Adams, H., Adger, W. N. & Nicholls, R. J. Modelling household well-being and poverty trajectories: an application to coastal Bangladesh. PLoS ONE 15 , e0238621 (2020).
Casado-Asensio, J., Drutschinin, A., Corfee-Morlot, J. & Campillo, G. Mainstreaming Adaptation in National Development Planning OECD Development Co-operation Working Paper No. 29 (OECD, 2016).
Ishiwatari, M. & Surjan, A. Good enough today is not enough tomorrow: challenges of increasing investments in disaster risk reduction and climate change adaptation. Prog. Disaster Sci. 1 , 100007 (2019).
Adnan, M. S. G., Abdullah, A. Y. M., Dewan, A. & Hall, J. W. The effects of changing land use and flood hazard on poverty in coastal Bangladesh. Land Use Policy 99 , 104868 (2020).
Eriksen, S. et al. Adaptation interventions and their effect on vulnerability in developing countries: help, hindrance or irrelevance? World Dev. 141 , 105383 (2021).
McMillan, J. M., Birkmann, J., Tangwanichagapong, S. & Jamshed, A. Spatial planning and systems thinking tools for climate risk reduction: a case study of the Andaman Coast, Thailand. Sustainability 14 , 8022 (2022).
Koks, E. E., Jongman, B., Husby, T. G. & Botzen, W. J. W. Combining hazard, exposure and social vulnerability to provide lessons for flood risk management. Environ. Sci. Policy 47 , 42–52 (2015).
Englund, M., André, K., Barquet, K. & Segnestam, L. Weather, Wealth and Well-Being: Cascading Effects of Water-Related Hazards and Social Vulnerability in Halmstad, Sweden SEI Discussion Brief (Stockholm Environment Institute, 2022).
Ferreira, O. et al. Storm-induced risk assessment: evaluation of two tools at the regional and hotspot scale. Coast. Eng. 134 , 241–253 (2018).
Murshed, S., Paul, D. J., Griffin, A. L. & Islam, M. A. A parsimonious approach to mapping climate-change-related composite disaster risk at the local scale in coastal Bangladesh. Int. J. Disaster Risk Reduct. 55 , 102049 (2021).
Bernhofen, M. V., Trigg, M. A., Sleigh, P. A., Sampson, C. C. & Smith, A. M. Global flood exposure from different sized rivers. Nat. Hazards Earth Syst. Sci. 21 , 2829–2847 (2021).
Chakraborty, J., Tobin, G. A. & Montz, B. E. Population evacuation: assessing spatial variability in geophysical risk and social vulnerability to natural hazards. Nat. Hazards Rev. 6 , 23–33 (2005).
Thacker, S. et al. Infrastructure for sustainable development. Nat. Sustain. 2 , 324–331 (2019).
Fuso Nerini, F. et al. Mapping synergies and trade-offs between energy and the sustainable development goals. Nat. Energy 3 , 10–15 (2017).
Fuso Nerini, F. et al. Connecting climate action with other sustainable development goals. Nat. Sustain. 2 , 674–680 (2019).
Adshead, D., Thacker, S., Fuldauer, L. I. & Hall, J. W. Delivering on the sustainable development goals through long-term infrastructure planning. Glob. Environ. Change 59 , 101975 (2019).
Adshead, D., Roman, O., Thacker, S. & Hall, J. W. Infrastructure strategies for achieving the global development agendas in small islands. Earths Future 9 , e2020EF001699 (2021).
Fuldauer, L. I. et al. Targeting climate adaptation to safeguard and advance the sustainable development goals. Nat. Commun. 13 , 3579 (2022).
ADS CAS PubMed PubMed Central Google Scholar
Fuldauer, L. I., Thacker, S. & Hall, J. W. Informing national adaptation for sustainable development through spatial systems modelling. Glob. Environ. Change 71 , 102396 (2021).
Adshead, D. et al. Ghana: Roadmap for Resilient Infrastructure in a Changing Climate (Ghana Ministry of Environment, Science, Technology and Innovation, 2022).
Fuldauer, L. I., Adshead, D., Thacker, S., Gall, S. & Hall, J. W. Evaluating the benefits of national adaptation to reduce climate risks and contribute to the sustainable development goals. Glob. Environ. Change 76 , 102575 (2022).
Gall, S. S. et al. Bangladesh: Climate-Resilient Infrastructure Assessment . (Global Center on Adaptation, 2022).
Brouwer, R., Akter, S., Brander, L. & Haque, E. Socioeconomic vulnerability and adaptation to environmental risk: a case study of climate change and flooding in Bangladesh. Risk Anal. 27 , 313–326 (2007).
PubMed Google Scholar
Islam, A. S., Bala, S. K. & Haque, M. A. Flood inundation map of Bangladesh using MODIS time-series images. J. Flood Risk Manage. 3 , 210–222 (2010).
Rahman, M. M. An analytical study of flood management in Bangladesh. IOSR J. Eng. 4 , 01–06 (2014).
CAS Google Scholar
Adnan, M. S. G., Haque, A. & Hall, J. W. Have coastal embankments reduced flooding in Bangladesh? Sci. Total Environ. 682 , 405–416 (2019).
ADS CAS PubMed Google Scholar
Rahman, S. & Rahman, M. A. Climate extremes and challenges to infrastructure development in coastal cities in Bangladesh. Weather Clim. Extrem. 7 , 96–108 (2015).
Islam, M. A., Griffin, A. L., Paul, D. J. & Murshed, S. Assessing critical infrastructure resilience in terms of its service-providing capacity in coastal Bangladesh: a synthesis of geospatial techniques and social responses. Int. J. Disaster Risk Reduct. 67 , 102633 (2022).
Bianchi, E. & Malki-Epshtein, L. Evaluating the risk to Bangladeshi coastal infrastructure from tropical cyclones under climate change. Int. J. Disaster Risk Reduct. 57 , 102147 (2021).
Rubinyi, S. et al. High-resolution synthetic population mapping for quantifying disparities in disaster impacts: an application in the Bangladesh coastal zone. Front. Environ. Sci . https://doi.org/10.3389/fenvs.2022.1033579 (2022).
Verschuur, J. et al. Welfare and Climate Risks in Coastal Bangladesh Policy Research Working Paper 10373 (World Bank, 2023).
Steptoe, H. & Economou, T. Extreme wind return periods from tropical cyclones in Bangladesh: insights from a high-resolution convection-permitting numerical model. Nat. Hazards Earth Syst. Sci. 21 , 1313–1322 (2021).
Wang, Z., Yu, M., Dong, S., Wu, K. & Gong, Y. Wind and wave climate characteristics and extreme parameters in the Bay of Bengal. Reg. Stud. Mar. Sci. 39 , 101403 (2020).
Lein, H. The poorest and most vulnerable? On hazards, livelihoods and labelling of riverine communities in Bangladesh. Singap. J. Trop. Geogr. 30 , 98–113 (2009).
Rahman, T., Mirza, A. T. M., Islam, S. & Rahman, S. H. Coping with flood and riverbank erosion caused by climate change using livelihood resources: a case study of Bangladesh. Clim. Dev. 7 , 185–191 (2015).
Chen, J. & Mueller, V. Coastal climate change, soil salinity and human migration in Bangladesh. Nat. Clim. Change 8 , 981–985 (2018).
Roman, O. et al. Optimizing rural drinking water supply infrastructure to account for spatial variations in groundwater quality and household welfare in coastal Bangladesh. Water Resour. Res. 57 , e2021WR029621 (2021).
Dasgupta, S., Hossain, M. M., Huq, M. & Wheeler, D. Facing the hungry tide: climate change, livelihood threats, and household responses in coastal Bangladesh. Clim. Change Econ. 7 , 1650007 (2016).
Paul, B. K., Rashid, H., Islam, M. S. & Hunt, L. M. Cyclone evacuation in Bangladesh: tropical cyclones Gorky (1991) vs. Sidr (2007). Environ. Hazards 9 , 89–101 (2010).
Zhang, W. & Wang, N. Resilience-based risk mitigation for road networks. Struct. Saf. 62 , 57–65 (2016).
Mar, A., Pereira, P. & Martins, J. F. A survey on power grid faults and their origins: a contribution to improving power grid resilience. Energies 12 , 4667 (2019).
Assad, A., Moselhi, O. & Zayed, T. A new metric for assessing resilience of water distribution networks. Water 11 , 1701 (2019).
Moallemi, E. A. et al. Achieving the sustainable development goals requires transdisciplinary innovation at the local scale. One Earth 3 , 300–313 (2020).
Rubinyi, S., Blankespoor, B. & Hall, J. W. The utility of built environment geospatial data for high-resolution dasymetric global population modeling. Comput. Environ. Urban Syst. 86 , 101594 (2021).
Adshead, D. et al. (2024). Data from: climate threats to coastal infrastructure and sustainable development outcomes (Data set). Zenodo https://doi.org/10.5281/zenodo.10554713 (2024).
Aqueduct Floods Hazard Maps (World Resources Institute, 2020).
Jarriel, T., Isikdogan, L. F., Bovik, A. & Passalacqua, P. System wide channel network analysis reveals hotspots of morphological change in anthropogenically modified regions of the Ganges Delta. Sci. Rep. 10 , 12823 (2020).
Paszkowski, A., Laurien, F., Mechler, R. & Hall, J.W. Quantifying community resilience to riverine hazards in Bangladesh. Glob. Environ. Change 84 , 102778 (2024).
Yu, D. et al. Disruption of emergency response to vulnerable populations during floods. Nat. Sustain. 3 , 728–736 (2020).
Creation of a Wealth Index . VAM Guidance Paper (World Food Programme, 2017).
Larsen, R. J. & Marx, M. L. An Introduction to Mathematical Statistics and Its Applications (Pearson, 2018).
Stock, R. Distance and the utilization of health facilities in rural Nigeria. Soc. Sci. Med. 17 , 563–570 (1983).
CAS PubMed Google Scholar
Thaddeus, S. & Maine, D. Too far to walk: maternal mortality in context. Soc. Sci. Med. 38 , 1091–1110 (1994).
van den Broek, N. et al. Reproductive health in rural Malawi: a population-based survey. BJOG 110 , 902–908 (2003).
Amin, Z. A. Learning to live with disasters. The Daily Star (2 December 2007).
Parvin, G. A., Sakamoto, M., Shaw, R., Nakagawa, H. & Sadik, M. S. Evacuation scenarios of cyclone Aila in Bangladesh: investigating the factors influencing evacuation decision and destination. Prog. Disaster Sci. 2 , 100032 (2019).
Download references
Acknowledgements
We acknowledge the Bangladesh Climate Change and Disaster Risk Management Team at the World Bank, in particular S. Kazi and I. Urrutia, for providing the synthetic household data and general support throughout the project. Any views expressed are not necessarily those of or endorsed by the World Bank. We also acknowledge support from the United Nations Office for Project Services (UNOPS), the Global Center on Adaptation (GCA), the Government of Bangladesh, and the Center for Environmental and Geographic Information Services (CEGIS) for assisting with access to data and in-country facilitation. We acknowledge imagery courtesy of the United Nations Sustainable Development Goals ( https://www.un.org/sustainabledevelopment ), although the content of this publication is not endorsed by the United Nations or its officials or the Member States.
Open access funding provided by Royal Institute of Technology.
Author information
Authors and affiliations.
KTH Climate Action Centre and Division of Energy Systems, KTH Royal Institute of Technology, Stockholm, Sweden
Daniel Adshead
Environmental Change Institute, University of Oxford, Oxford, UK
Daniel Adshead, Amelie Paszkowski, Sarah S. Gall, Alison M. Peard, Jasper Verschuur & Jim W. Hall
Department of Civil and Environmental Engineering, University of Strathclyde, Glasgow, UK
Mohammed Sarfaraz Gani Adnan
Department of Urban and Regional Planning, Chittagong University of Engineering and Technology, Chattogram, Bangladesh
You can also search for this author in PubMed Google Scholar
Contributions
D.A., S.S.G. and A.P. contributed to the design of the study. S.S.G., D.A. and J.V. developed methods for the parts of the analysis. S.S.G., A.M.P. and D.A. performed most of the data analysis. D.A. and A.M.P. generated the figures and visualizations used in the manuscript. A.P. and M.S.G.A. contributed to the interpretation of the results. D.A. and A.P. wrote the manuscript. A.M.P., S.S.G., M.S.G.A., J.V. and J.W.H. provided written contributions and advisory feedback. A.P. coordinated the research and most of the stakeholder consultations. All authors reviewed and provided edits on the final manuscript.
Corresponding author
Correspondence to Daniel Adshead .
Ethics declarations
Competing interests.
The authors declare no competing interests.
Peer review
Peer review information.
Nature Climate Change thanks Ashraful Islam, Bruno Merz and Fahim Tonmoy for their contribution to the peer review of this work.
Additional information
Publisher’s note Springer Nature remains neutral with regard to jurisdictional claims in published maps and institutional affiliations.
Supplementary information
Supplementary information.
Supplementary Figs. 1–3 and Tables 1 and 2.
Rights and permissions
Open Access This article is licensed under a Creative Commons Attribution 4.0 International License, which permits use, sharing, adaptation, distribution and reproduction in any medium or format, as long as you give appropriate credit to the original author(s) and the source, provide a link to the Creative Commons licence, and indicate if changes were made. The images or other third party material in this article are included in the article’s Creative Commons licence, unless indicated otherwise in a credit line to the material. If material is not included in the article’s Creative Commons licence and your intended use is not permitted by statutory regulation or exceeds the permitted use, you will need to obtain permission directly from the copyright holder. To view a copy of this licence, visit http://creativecommons.org/licenses/by/4.0/ .
Reprints and permissions
About this article
Cite this article.
Adshead, D., Paszkowski, A., Gall, S.S. et al. Climate threats to coastal infrastructure and sustainable development outcomes. Nat. Clim. Chang. (2024). https://doi.org/10.1038/s41558-024-01950-2
Download citation
Received : 25 July 2023
Accepted : 09 February 2024
Published : 01 March 2024
DOI : https://doi.org/10.1038/s41558-024-01950-2
Share this article
Anyone you share the following link with will be able to read this content:
Sorry, a shareable link is not currently available for this article.
Provided by the Springer Nature SharedIt content-sharing initiative
Quick links
- Explore articles by subject
- Guide to authors
- Editorial policies
Sign up for the Nature Briefing newsletter — what matters in science, free to your inbox daily.

Academia.edu no longer supports Internet Explorer.
To browse Academia.edu and the wider internet faster and more securely, please take a few seconds to upgrade your browser .
Enter the email address you signed up with and we'll email you a reset link.
- We're Hiring!
- Help Center

Coastal Erosion Hazard and Vulnerability: Case Study of Porticello, South Calabria, Italy

Coastal erosion is due to natural phenomena and anthropogenic interventions that alter the coastal dynamics and the sediment balance. Therefore, to manage the coastal areas and to correctly design the necessary defence interventions, it is necessary to analyze all these factors. Consequently, in recent years the methodologies for the coastal erosion hazard and vulnerability assessment have increasing importance. However, there is currently a lack of a general methodology that considers all the factors that influence the coastal dynamics and, therefore, the hazard and the vulnerability. This paper, through a case study, describes a new methodology based on indices that considers all the factors that influence the hazard and the vulnerability, thus resulting in general validity. This methodology defines two indices of hazard and vulnerability. The hazard index considers all the natural processes that contribute to the phenomenon of coastal erosion, such as tides, currents, average sea...
Related Papers
Environmental Processes
Nicola Cantasano
Roberto Tomasicchio , Francesca Principato , Giuseppe Tomasicchio
The coastal vulnerability index (CVI) is a popular index in literature to assess the coastal vulnerability of climate change. The present paper proposes a CVI formulation to make it suitable for the Mediterranean coasts; the formulation considers ten variables divided into three typological groups: geological; physical process and vegetation. In particular, the geological variables are: geomorphology; shoreline erosion/accretion rates; coastal slope; emerged beach width and dune width. The physical process variables are relative sea-level change; mean significant wave height and mean tide range. The vegetation variables are width of vegetation behind the beach and posidonia oceanica. The first application of the proposed index was carried out for a stretch of the Apulia region coast, in the south of Italy; this application allowed to (i) identify the transects most vulnerable to sea level rise, storm surges and waves action and (ii) consider the usefulness of the index as a tool for orientation in planning strategies. For the case study presented in this work, the most influential variables in determining CVI are dune width and geomorphology. The transects that present a very high vulnerability are characterized by sandy and narrow beaches (without dunes and vegetation) and by the absence of Posidonia oceanica.
Journal of Coastal Conservation
Umberto Simeoni
P. Bellotti , C. Tarragoni , E. Lupia Palmieri
Coasts are highly sensitive to dynamic geomorphic processes that determine rapid environmental changes and landscape modifications and are potentially vulnerable to accelerated erosion hazard. Coasts densely inhabited and settled by human infrastructures are threatened by severe erosional processes; therefore the coastal vulnerability analysis may represent an essential tool for hazard mitigation and management purposes. Tiber River delta has been selected as study area because it has a particularly high vulnerability to sea erosion that has made necessary several protection interventions in recent decades. The Local Vulnerability Assessment (LVA ) methodology proposed differs from the previous ones for two aspects: the working scale (with its morphological and climatic implications), and the distinction between potential (due to natural conditions alone) and effective vulnerability (where the anthropogenic action is present and may contribute to vulnerability mitigation or less). The LVA takes into account quantitative and qualitative spatial variables that express morphometric and morphodynamic natural factors of vulnerability, as well as selected anthropogenic factors. Based on a system of numerical weights and scores, the LVA allows the construction of a local vulnerability map in which the Coastal Vulnerability Index (CVI ) is represented for different sectors of the study area. The aim of LVA is to single out he main vulnerable zones that should have priority in the mitigation strategy performed within the study area. This is the first study finalized to calculate CVI at local scale and its results show that the whole coast strip of the study area has high and very high values of potential vulnerability, while the values of effective vulnerability decrease where suitable defences are present.
alessio satta
Coastal zones are exposed to the continuous action of several factors such as wave height and direction, wind speed, water depth, sediment dynamics, relative sea level change, rainfall and storm surges. All these natural factors make coastal areas highly vulnerable. The interaction between sea level rise and marine storms variability can produce several physical effects, like storm surges affecting coastal systems and low-lying areas. These physical effects can intensify the impacts of natural hazards on coastal zones, in particular those most vulnerable in terms of reduced capacity of adaptation of the ecological and the socio-economic systems. Coastal zones have a crucial importance for the Mediterranean countries as they represent a significant part of their economic activities. The increased risks of natural hazards exacerbated by climate change and the growing concentration of people and activities on Mediterranean coastal regions, could generate disputes on the use of coastal areas and resources requiring updated information and a better understanding on coastal zones vulnerability and exposure at the local scale. Even if extreme events often cannot be predicted, adaptation measures can be planned to reduce the potential risks and to cope with uncertainties. In order to support Mediterranean coastal policy makers in planning adaptation to the physical effects of climate and non-climate changes, the main aim of this research is to develop an Index-based method for the integrated assessment of coastal risk to multiple hazards (MHCRI), which takes into account the effects of sea level rise and storms variability together with human induced forcing. This research considers population growth and tourism development as the most significative human induced drivers and focuses on coastal erosion, coastal flooding and saltwater intrusion as the most relevant natural hazards in the Mediterranean coastal zones. The present thesis adopts the conceptual framework for vulnerability and risk defined in the Fifth Assessment Report (IPCC, 2014). A risk function is developed in order to operationalize the concept of risk into a concrete assessment method. Risk results from the joint action of climate and non-climate forcing and naturals hazards on the coastal system, which is described in terms of vulnerability and exposure. Forcing, Hazard, Vulnerability and Exposure represent the four factors of the Risk function and they are characterized by multiple variables. These variables, defined with relative scores and classes, are associated to the coastal spatial unit defined for the research through a GIS application. The GIS allows calculating the values related to simple or complex variables and to build layers that represent the single factor (e.g. exposure) or the risk index. With reference to the provisions of the ICZM Protocol, we introduce a methodology to define the limits of the coastal hazard zones and the setback lines for coastal erosion, coastal flooding and saltwater intrusion. The coastal hazard zone, intended as a coastal area where the risk occurs, represents the spatial field of application of the index-based method. Firstly a risk index is developed for each natural hazard namely the Coastal Erosion Risk Index (CERI), the Coastal Flooding Risk Index (CFRI), and the Salt Water Intrusion Risk Index (SWIRI). Secondly the multiple hazards risk index (MHCRI) is developed as a function of the three single hazard indices (CERI, CFRI and SWIRI). The field of application of the MHCRI is the coastal portion defined by the overlapping of the hazard zones identified for erosion, flooding and saltwater intrusion. The Risk value is calculated for each coastal spatial unit applying the Risk function. Multiple hazards risk results from the overlay of the three single hazards as the sum of the values assigned to the variables of each index. The results are mapped in a coastal risk map. The index-based method developed for this research is applied to a concrete case in the western shore of Sardinia and more precisely to the Gulf of Oristano, which is characterised by low-lying areas particularly vulnerable to sea level rise and by intense Storms driven by the winds of the fourth quadrant. The study area is divided in twenty-one coastal units according to coastal geomorphology: seventeen beach shores, three cliffs shores and one coastal lagoon. The MHCRI method is implemented to the Gulf of Oristano in order to analyse the potential consequences of climate and non-climate forcing on coastal erosion, coastal flooding and saltwater intrusion hazards and their impacts on the coastal assets at risk. The Exposure variables are evaluated through expert judgement based on a panel of experts specifically involved for this research. The outputs of the proposed coastal risk assessment method include vulnerability and risk maps for each single hazard and for multiple hazards that can be used to support Mediterranean coastal communities in the implementation of ICZM planning and adaptation measures. Vulnerability map for coastal erosion hazard shows “moderate” to “high” vulnerability values for the beach shores. This result is due to a low resilience of the shoreline associated to high susceptibility. The Risk map for coastal erosion reveals that the highest level of risk is "moderate" associated to urban settlements nearby the dune system. This is due to the low levels of forcing and hazard that insist on this shoreline. As expected the cliff shores present a very low risk to coastal erosion. Vulnerability map for coastal flooding hazard shows values ranging from moderate to high notwithstanding the high to very high susceptibility of the low-lying coastal areas. This result is due to the compensation effect of resilience variables (e.g. ecosystems health and drainage density). The Risk map for coastal flooding shows a moderate to high risk to some coastal villages settled near the shoreline and a moderate risk to flooding for agricultural settlements. The map shows a moderate risk to flooding also at a distance greater than 2km from the shoreline (e.g. the low-lying areas of the “Bonifica di Arborea”). The Vulnerability map for salt-water intrusion shows that the zones of the aquifer closer to the shoreline present the highest vulnerability values. The susceptibility to salt water intrusion is defined adapting the GALDIT index variables to the method proposed for this research. On the other side the Risk map for salt-water intrusion shows the high values for risk for almost the whole aquifer except the areas closer to the shoreline. This result shows the limitations of methods like GALDIT that focusing just on physical variables do not describe the effects of the socioeconomic variables. The coastal - 15 - hazard zone for multiple hazards where the MHCRI is applied, is given by the common area resulting from the overlay of the layers of the hazard zones defined for erosion, flooding and saltwater intrusion. The Vulnerability map for multiple hazards is represented by the sum of the vulnerability values associated to each spatial unit with respect to each Index. The risk map for multiple hazards is also represented by the information associated to each single risk map. The MHCRI index allows the identification of coastal assets exposed to the effects of different hazards and of areas contemporarily exposed to the three hazards. The variable "hazard" is the major innovation introduced in the function of risk than existing indexes. In addition, the variable that describes Hazard factor in the absence of forcing plays a key role in the definition of risk. Further research is required to apply the index to other contexts and to better refine the values and the classes defined for the various factors and in particular for Hazard.
Gaia Mattei
High coastal sectors constitute the most widespread coastal environment and, under the present accelerated sea-level rise scenario, are suffering huge impacts in terms of erosion. The aim of this paper is the proposal of a new methodological approach for the assessment of their susceptibility to erosive processes. The method is based on the combination of two matrices, i.e., a matrix considering the main physical elements (essentially morphological and geotechnical characteristics) that determine the proneness to erosion of a specific high coastal sector, and a forcing matrix, which describes the forcing agents affecting the considered sector. Firstly, several variables were selected to construct each one of the two matrices according to existing studies and, in a second step, they were interpolated to obtain the susceptibility matrix (CSIx). The approach was applied to Procida Island and Cilento promontory, both located in southern Italy. Results obtained were validated by comparin...
Journal of Marine Science and Engineering
Νικόλαος Δεπούντης
The aim of this specific study is to present a new weighted Coastal Vulnerability Index (CVIWF), with an emphasis given to the geotechnical evaluation and shoreline evolution rate measured through high-resolution remote sensing, which seem to be the most interfering variables in CVI calculations. As a pilot area for the application of the new CVIWF, the Gulf of Patras in Western Greece was selected, which is suffering erosion problems due to climate change, the sea level rising and human intervention. The new CVIWF, which was applied in this research, includes the following innovations: (1) the use of geotechnical characterization instead of geological–geomorphological characterization, (2) the use of high-resolution remote sensing data for the detection of shoreline evolution rate and (3) the insertion of a specific weighted geotechnical factor in the CVIWF formula. The results from the application of the unweighted CVI show that percentages of 20.13%, 20.47%, 24.56%, 29.39% and 5....
Engineering Geology for Society and Territory - Volume 4
Guido Benassai , Marinella Passarella , Luigi Mucerino
Enzo Pranzini
The assessment of coastal erosion risk is a major challenge, since environmental and geomorphic features, together with sea state parameters, can seriously change the configuration of coastal areas. In addition, the anthropic actions of the coastal communities may also drastically modify the configuration of the coast in vulnerable areas. In this study, a linkage between regional mapping guidelines and national geological cartography procedures is presented as a meaningful tool in the geomorphic trends analysis for the integrated mapping of the main morphological patterns of San Vincenzo’s coastal area, in the region of Tuscany (Italy). Comparing and joining different procedures—which have different scales and topics—requires adapting the fields and the information provided in maps and databases. In this case study, a GIS morpho-sedimentological approach is developed. This GIS approach enables us to cover several issues simultaneously, such as the representation of coastal active pr...
oswaldo coca
A hazard and vulnerability assessment of coastal erosion is an essential first step for planning and decision-making, because it is part of risk management and its results are in the form of easily interpreted traffic-light maps. For the analysis of the assessment in this work, a methodology is proposed which considers three components for both hazard (magnitude, occurrence, and susceptibility) and vulnerability (exposure, fragility, and lack of resilience), through a semi-quantitative approximation, by applying relative indices to different variables. This methodology has been adapted to analyze hazards and vulnerability caused by coastal erosion combining physical and social aspects. For the validation of this methodology, Spratt Bight Beach (Colombian Caribbean) and La Bocana beach (Colombian Pacific) were selected in order to have contrasting regions and to validate the application of the method over a geographical range. One of the most significant outcomes of the assessment of...
RELATED PAPERS
Krishnamurthy Sairam
JHA - Journal of HIV and Ageing
Giovanni Cenderello
Tijdschrift voor Bedrijfs- en Verzekeringsgeneeskunde
Angelique Weel
AIP Conference Proceedings Volume 68
Andrzej Buras
Lirian Sifuentes
fitrotin azizah
Marcelo Teixeira De Medeiros
Journal of Cranio-Maxillofacial Surgery
Giorgia Saia
Edita Gruodytė
oral health and dental management
Carmen Hanganu
International Quarterly of Community Health Education
Marc Pilisuk
Gynecologic Oncology
Sandra Tomek
Veterinary Radiology & Ultrasound
INFORME ALMA DELIA ARVIZU GARCIA
ALMA DELIA ARVIZU GARCIA
Geophysical Research Letters
Jean-Marie Mengus
International Journal of Computer Applications
Sonia C A H Y A Pratiwi
Samuel Iyase
The Pediatric Infectious Disease Journal
Michael Harari
Annals of General Psychiatry
Kenneth Kobak
Jurnal Akuntansi dan Keuangan Indonesia
Retno Wigati
Journal of the Mexican Chemical Society
Uriel Herrera Flores
Sandra Rodrigues
Chemie Ingenieur Technik
CAMELIA MANESCU
Journal of Applied Polymer Science
Muhammad Ishaq
See More Documents Like This
- We're Hiring!
- Help Center
- Find new research papers in:
- Health Sciences
- Earth Sciences
- Cognitive Science
- Mathematics
- Computer Science
- Academia ©2024

‘In the Shadow of the Seawall’ tackles coastal land use dilemmas in the age of sea level rise
The Earth is warming, prompting existential questions for the more than three billion of us living on the world’s coasts. Rising sea levels are chipping away at habitable land, affecting livelihoods, damaging infrastructure and contaminating groundwater. This instability is expected to force a reckoning: How much time, energy and resource will we spend trying to maintain life and business as we know it in the face of unrelenting climatic change? How might it shift how we relate to and value the coast?
In addition to raising those questions and others like them, for UC Santa Barbara sociologist Summer Gray , rising seas do something else: They expose age-old social injustices and inequalities and offer them up for examination. In her first book, “In the Shadow of the Seawall ” (University of California Press, 2023), Gray takes two communities that are on the front lines of sea level rise — the Maldives, an island country in the north-central Indian Ocean, and Guyana, an Atlantic Ocean-facing nation in the northeastern corner of South America — and studies how seawalls serve as a point of conflict between rich and poor, colonizer and Indigenous, powerful and powerless.
“Guyana and the Maldives immediately captured my attention due to their vivid illustration of the ramifications of climate injustice amidst historical legacies of colonization and uneven development,” Gray said. Both nations are engaged in a relentless struggle for survival, she added, and through their dilemmas it becomes apparent that issues of climate justice go beyond statistics of carbon emissions and extreme weather events.
Both real and symbolic representations of man’s struggle to keep nature at bay, hard coastal structures in these countries can

be traced all the way back to the days of European colonization, when taming the ocean was a sign of progress and power. Generations later, though both countries have since achieved independence, their populations are still locked in the same patterns of economic dependence on these structures — the growing amount of money and effort required to maintain them in order to support economies and land uses that have grown around them.
“They also symbolize entrenched patterns of centralized development and engineering paradigms that are deeply ingrained and almost impossible to reverse,” Gray said. While they are effective at stabilizing land and preventing coastal erosion, they come at enormous human and environmental costs and, ironically, further exacerbate coastal vulnerability, she continued. It’s a sunk cost fallacy that is emerging in coastal cities everywhere as they grapple with encroaching seas.
“I think that first we have to consider the social, cultural and environmental ramifications of business-as-usual development practices.”
And yet, the near-term economic and social impacts of ceding to the ocean are also undeniable, given current, capitalistic views of the coast, and these impacts often threaten the livelihoods and social connections of the least powerful — the ones that have the fewest resources to adapt to change. This is one of the core dilemmas that seawalls represent, and it’s not isolated to remote island nations or developing countries. Gray also looks at seawalls in the developed world, like the Big U, a controversial six-mile
swinging barrier in progress that is meant to protect New York City from future storm surges. Along with the estimated $119 million price tag, the project raises concerns over whether the finished product will even be effective, let alone be worth the unintended consequences.
Against this backdrop, Gray brings out the concept of placekeeping, a place-sensitive approach to climate change adaptation. Going farther than conventional notions of adaptation, which often involve well-intentioned but rather blunt strategies to invest in coastal armoring or conduct a managed retreat, placekeeping is holistic and hyperlocal, beginning with understanding coastal vulnerability within place-specific social and historical contexts.
“I think that first we have to consider the social, cultural and environmental ramifications of business-as-usual development practices,” Gray said. “The stories of Guyana and the Maldives strongly suggest that seawalls encapsulate political dynamics that perpetuate hierarchies and dependencies, imposing constraints on future generations that are difficult to overcome. In the case of New York, I think that there are better — and more socially just — approaches to this problem, such as transforming vulnerable areas into places of non-extractive living.”

Indeed, placekeeping strategies would differ from coastal community to coastal community, as the populations “assert their autonomy and shape life-affirming pathways amid environmental disruption,” according to Gray. It could mean a thinning of the land use in vulnerable areas; it could mean relocation. But it could also mean better public transit to enhance access and mobility, as well as nature-based resilience measures and innovative and just social and economic solutions.
“Ultimately, at its heart, placekeeping reflects a deep-seated yearning to uphold our ties to and presence within the places we call home while recognizing that this desire is embedded in relationships of power,” Gray said. “I wrote ‘In the Shadow of the Seawall ’ as a corrective to the simplified and sensationalized narratives that dominate both popular and academic climate change discourses.
“My hope is that the book will awaken the sociological imagination, inviting readers into a world where the complexities of seawalls, placekeeping and adaptation, challenge assumptions and contribute to a more connected understanding of the struggle ahead.”
Sonia Fernandez Senior Science Writer (805) 893-4765 [email protected]
Share this article
About UC Santa Barbara
The University of California, Santa Barbara is a leading research institution that also provides a comprehensive liberal arts learning experience. Our academic community of faculty, students, and staff is characterized by a culture of interdisciplinary collaboration that is responsive to the needs of our multicultural and global society. All of this takes place within a living and learning environment like no other, as we draw inspiration from the beauty and resources of our extraordinary location at the edge of the Pacific Ocean.
Related Stories

March 5, 2024
Historian Nelson Lichtenstein: Clinton betrayed progressives, capitulated to the right

February 28, 2024
A holistic framework for studying social emotions

February 8, 2024
Embracing single life: Love, intimacy and family beyond the couple

February 6, 2024
Is housing a human right?
IMAGES
COMMENTS
PDF | On Nov 30, 2013, Durusoju Hari Prasad and others published Coastal Erosion Studies—A Review | Find, read and cite all the research you need on ResearchGate
The size of the observed changes can differ strongly between coastal stretches. The length of cross-shore land erosion or active zone accretion exceeds 50 m in about 13% of the transects, while ...
Coastal erosion, which is the wearing away of coastal land or ... Carolina's Coast" (PDF). Nicholas School of the Environment of Duke University. Retrieved 15 October 2013. [9]. ... Environment: A Case Study of Valinokkam to Thoothukudi Area, Tamil Nadu, India. International Journal of Innovative Technology
In figure 4, the frequencies of northern coastal communities at various coastal landforms are plotted in light gray; the frequencies of erosion control case studies (total number n = 32) collected in this study were plotted in dark gray. The frequency of the case studies indicate that more measures had been repeatedly constructed in barrier ...
Seawalls as a response to coastal erosion and flooding: a case study from Grande Comore, Comoros (West Indian Ocean) Carola Betzold1 • Ibrahim Mohamed2 Received: 29 November 2015/Accepted: 13 August 2016/Published online: 14 September 2016 Springer-Verlag Berlin Heidelberg 2016 Abstract Many coasts are eroding. In the Comoros, as in
Abstract. In many parts, coastal erosion is severe due to human-induced coastal zone development and storm im-pacts, in addition to climate change. In this study, the beach erosion risk was defined, followed by a quantitative assess-ment of potential beach erosion risk based on three com-ponents associated with the watershed, coastal zone devel-
Therefore, it may be impractical for coastal managers to apply these methods to field condition for coastal erosion management. In this study, we present a method to assess the potential erosion risk induced by the combined action of processes acting at different time scales and with minimal basic survey data. 2.1 Definition of beach erosion risk
Coastal erosion and potential response measures. Erosion is widespread along the world's coasts. A first global assessment in the 1980s showed that 70 % of the world's beaches were eroding (Bird 1985).Many anthropogenic processes, such as land reclamation, construction of causeways and other infrastructure, or sand mining, lead to coastal erosion, which in turn makes flooding more likely.
The strategy that has traditionally been used to face coastal erosion is the building of hard engineering structures, although beach nourishment has been already attempted and proven successful. In this paper, two case studies are used to compare the local and global cost-effectiveness of a "hard" and a "soft" approach.
port defence works, the subsidence rates and the degree of waterproofing of the coast. The case study concerns Porticello, a town near the Strait of Messina characterized by a high coastal erosion risk. Porticello represents an interesting case study due to the peculiarities of the Strait of Messina and the presence of numerous coastal structures.
The objective of this study was to assess the effect of shoreline retreat and dune erosion on coastal flooding in a case study located in the southern coast of Rhode Island, USA. Using an extensive dataset collected during 2011, an ADCIRC model was developed to simulate the propagation of storm surge in the coastal areas, including coastal inlets and ponds. A simplified methodology, based on ...
Cape Cod Coastal Erosion: A Case Study Problems Coastal erosion is a natu ral geological process. It may take place slowly over thou sands of years or it may occur dramatically, as in a landslide near Highland Light in Truro, Massachusetts, in early 1996. Sea level rise accelerates the process of coastal erosion, qnd relative
Case Study 3: Shell Mound Sites Threatened by Sea Level Rise and Erosion, Canaveral National Seashore, Florida ... This report includes 24 case studies of adaptation to coastal changes. The adaptation efforts described here include historic structure preservation, archeological
The main objective of this paper is to assess the vulnerability of Tuticorin coast for erosion and coastal change using CVI based on multi-indicator approach, in a view to identify and quantify the low-lying areas. Beach width, bathymetry and coastal elevation are considered as additional parameters for calculating CVI.
The destructive impact of coastal erosion on archaeological sites and monuments is a well-recognized and globally documented phenomenon ... Assessing the Impact of Coastal Erosion on Archaeological Sites: A Case Study from Northern Ireland. ... 48 hours access to article PDF & online version; Article PDF can be downloaded;
Coastal Erosion Studies—A Review. The land ward displacement of the shoreline caused by the forces of waves and currents is termed as Coastal Erosion. The Coastal areas have become more prone and vulnerable to natural and human made hazards which lead to Coastal Erosion. The Shoreline retreat is recognized as a burgeoning threat because of ...
Climate hazards pose increasing threats to development outcomes across the world's coastal regions by impacting infrastructure service delivery. Using a high-resolution dataset of 8.2 million ...
Case Study of Coastal Erosion - Flamborough Head and Holderness Coast Background and the Problem of Erosion - The Holderness Coast is on the NE coast of the UK, facing the North Sea. - It extends 60km from Flamborough in the north to Spurn Point in the south. - Coastline mainly made up of cliffs (20-30m high), made of soft, easily eroded ...
The study area extends for about 1.5 km, inside there are numerous coastal structures, two river mouths and numerous houses built close to the shoreline. Keywords: coastal erosion, coastal erosion risk assessment, hazard, vulnerability, index-based methodology, coastal structures.
The coasts of the Mediterranean basin are exposed to the ongoing effects of climate change and anthropogenic pressure. Low elevated coastal plains, river deltas, lagoons and reclamation areas are experiencing beach retreat, coastal erosion and marine flooding. This makes them particularly vulnerable to sea level rise (SLR), which is expected to increase up to 1 m by 2100 AD, according to the ...
In her first book, "In the Shadow of the Seawall " (University of California Press, 2023), Gray takes two communities that are on the front lines of sea level rise — the Maldives, an island country in the north-central Indian Ocean, and Guyana, an Atlantic Ocean-facing nation in the northeastern corner of South America — and studies how ...