Spoton-N-First with Mrs Von Der Lieth
This is a first grade blog designed to help my class with our Go Math Program. The Go Math Program is designed to go along with the Common Core Standards. Each lesson covers a different standard, gives the objective, new vocabulary words that were introduced, and a video that explains the homework sheet. I hope this is helpful to my classroom as well as others!

Wednesday, March 19, 2014
Chapter 10- represent data.
- picture graph
- tally chart
No comments:
Post a comment.

Chapter 10: Represent Data

Chapter 10 Essential Question:
Chapter 10 objectives:.
- Analyze and compare data shown in a picture graph where each symbol represents one.
- Make a picture graph where each symbol represents one and interpret the information.
- Analyze and compare data shown in a bar graph.
- Make a bar graph and interpret the information.
- Analyze and compare data shown in a tally chart.
- Make a tally chart and interpret the information.
- Solve problem situations using the strategy make a graph .

GO Math! is Online

iTools Primary

Interactive Student Edition-This is a great way to preview or review the math skills for the chapter!
- Lesson 10.1- Read Picture Graphs
- Lesson 10.2- Hands On: Make Picture Graphs
- Lesson 10.3- Read Bar Graphs
- Lesson 10.4- Hands On: Make Bar Graphs
- Lesson 10.5- Read Tally Charts
- Lesson 10.6- Hands On: Make Tally Charts
- Lesson 10.7- Problem Solving: Represent Data

Math On the Spot Videos-Cute videos that model problems within each lesson.

Animated Math Models-Practice some of your math skills with Curious George!
- Lesson 10.1 and 10.2 (Skill 43)- Make and Interpret Picture Graphs
- Lesson 10.5 (Skill 44)- Tally Charts
- Lesson 10.6 (Skill 45)- Make Tally Charts

Mega Math Games-Fun games that reinforce concepts taught within the chapter.
- Lesson 10.1- Country Countdown, White Water Graphing- Level A
- Lesson 10.1- Country Countdown, White Water Graphing- Level C
- Lesson 10.2- Country Countdown, White Water Graphing- Level B
- Lesson 10.3 and 10.4- Country Countdown, White Water Graphing- Level F
First Grade Team
Location: East Heritage Elementary School, East Constitution Way, Fontana, CA, United States Phone: 909-823-5696
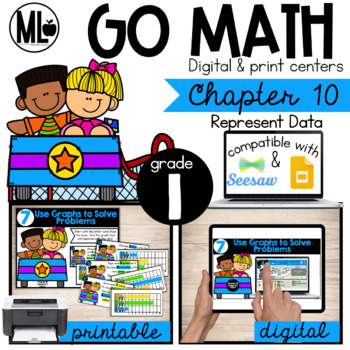
GoMath Centers-Chapter 10-Represent Data, Printable & Distance Learning
- Google Apps™
What educators are saying
Also included in.
Description
This FIRST GRADE product was created as a companion to the GoMath Curriculum. This resource is an UNOFFICIAL companion and is NOT endorsed by Houghton Mifflin.
I have used Chapter 10 – Represent Data , as a guide in creating these math centers. Lesson numbers are included in the centers to help guide your usage of the centers with your students. These centers are a great way to review the concepts taught in the chapter. They are perfect to use in small groups or as independent work for your higher leveled students.
This product includes a black and white version if you choose to save on colored ink.
DIGITAL VERSIONS:
I have changed these centers so there are only one or two problems per slide. This should make it easier for littles to use.
GOOGLE Slides - This version has 52 pages. (See the breakdown below) You can delete any pages you do not need
SEESAW - This version is separated into Centers. These are now individual so you can assign only what you want your students to practice.
When creating these centers, I have used the chapter test as a guide when creating the centers. The centers focus on activities that students can practice before taking the test.
The centers and their corresponding Lesson are listed below
⚫️Center 1 - Lesson 10.1 - Picture Graphs (1.MD.4)
PDF - 4 pages, 6 problems
DIGITAL (GOOGLE | SEESAW) - 7 slides, 6 interactive problems
⚫️Center 2 - Lesson 10.2 - Use a Picture Graph to Answer a Question (1.MD.4)
⚫️Center 3 - Lesson 10.3 - Reading Bar Graphs (1.MD.4)
⚫️Center 4 - Lesson 10.4 - Usse a Bar Graph to Comapre (1.MD.4)
⚫️Center 5 - Lesson 10.5 - Read and Interpret Tally Charts (1.MD.4)
PDF - 4 pages, 9 problems
DIGITAL (GOOGLE | SEESAW) - 10 slides, 9 interactive problems
⚫️Center 6 - Lesson 10.6 - Make a Tally Chart (1.MD.4)
PDF - 3 pages, 6 problems
⚫️Center 7 - Lesson 10.7 - Use Graphs to Solve Problems (1.MD.4)
Make sure to download the preview for a closer look!
Click the links to view the remaining chapters.
Chapter 10--> You are here
Or you can purchase the bundle here.
BUY the BUNDLE!
Questions & Answers
Gluesticks and crayons by michelle lanning.
- We're hiring
- Help & FAQ
- Privacy policy
- Student privacy
- Terms of service
- Tell us what you think

- school Campus Bookshelves
- menu_book Bookshelves
- perm_media Learning Objects
- login Login
- how_to_reg Request Instructor Account
- hub Instructor Commons
- Download Page (PDF)
- Download Full Book (PDF)
- Periodic Table
- Physics Constants
- Scientific Calculator
- Reference & Cite
- Tools expand_more
- Readability
selected template will load here
This action is not available.
10.7: Exercise
- Last updated
- Save as PDF
- Page ID 109913

- David Lippman & Jeff Eldridge
- Pierce College via The OpenTextBookStore
- What is the population of this survey?
- What is the size of the population?
- What is the size of the sample?
- Give the sample statistic for the proportion of voters surveyed who said they were supporting the education bill.
- Based on this sample, we might expect how many of the representatives to support the education bill?
- Give the sample statistic for the proportion of voters surveyed who said they'd vote for Brown.
- Based on this sample, we might expect how many of the 9500 voters to vote for Brown?
- Identify the most relevant source of bias in this situation: A survey asks the following: Should the mall prohibit loud and annoying rock music in clothing stores catering to teenagers?
- Identify the most relevant source of bias in this situation: To determine opinions on voter support for a downtown renovation project, a surveyor randomly questions people working in downtown businesses.
- Identify the most relevant source of bias in this situation: A survey asks people to report their actual income and the income they reported on their IRS tax form.
- Identify the most relevant source of bias in this situation: A survey randomly calls people from the phone book and asks them to answer a long series of questions.
- Identify the most relevant source of bias in this situation: A survey asks the following: Should the death penalty be permitted if innocent people might die?
- Identify the most relevant source of bias in this situation: A study seeks to investigate whether a new pain medication is safe to market to the public. They test by randomly selecting 300 men from a set of volunteers.
- In a study, you ask the subjects their age in years. Is this data qualitative or quantitative?
- In a study, you ask the subjects their gender. Is this data qualitative or quantitative?
- Does this describe an observational study or an experiment: The temperature on randomly selected days throughout the year was measured.
- Does this describe an observational study or an experiment? A group of students are told to listen to music while taking a test and their results are compared to a group not listening to music.
- In a study, the sample is chosen by separating all cars by size, and selecting 10 of each size grouping. What is the sampling method?
- In a study, the sample is chosen by writing everyone’s name on a playing card, shuffling the deck, then choosing the top 20 cards. What is the sampling method?
- Which is the treatment group?
- Which is the control group (if there is one)?
- Is this study blind, double-blind, or neither?
- Is this best described as an experiment, a controlled experiment, or a placebo controlled experiment?
- Is this a sampling or a census?
- Is this an observational study or an experiment?
- Are there any possible sources of bias in this study?
- This study involves two kinds of non-random sampling: (1) Subjects are not randomly sampled from some specified population and (2) Subjects are not randomly assigned to groups. Which problem is more serious? What affect on the results does each have?
- A farmer believes that playing Barry Manilow songs to his peas will increase their yield. Describe a controlled experiment the farmer could use to test his theory.
- A sports psychologist believes that people are more likely to be extroverted as adults if they played team sports as children. Describe two possible studies to test this theory. Design one as an observational study and the other as an experiment. Which is more practical?
Exploration
- What is the population of this study?
- List two reasons why the data may differ.
- Can you tell if one researcher is correct and the other one is incorrect? Why?
- Would you expect the data to be identical? Why or why not?
- If the first researcher collected her data by randomly selecting 40 states, then selecting 1 person from each of those states. What sampling method is that?
- If the second researcher collected his data by choosing 40 patients he knew. What sampling method would that researcher have used? What concerns would you have about this data set, based upon the data collection method?
- Find a newspaper or magazine article, or the online equivalent, describing the results of a recent study (the results of a poll are not sufficient). Give a summary of the study’s findings, then analyze whether the article provided enough information to determine the validity of the conclusions. If not, produce a list of things that are missing from the article that would help you determine the validity of the study. Look for the things discussed in the text: population, sample, randomness, blind, control, placebos, etc.
- Texas Go Math
- Big Ideas Math
- enVision Math
- EngageNY Math
- McGraw Hill My Math
- 180 Days of Math
- Math in Focus Answer Key
- Math Expressions Answer Key
- Privacy Policy
Go Math 1st Grade Answer Key Chapter 10 Represent Data 10.7 6

Leave a Reply Cancel reply
You must be logged in to post a comment.
- Texas Go Math
- Big Ideas Math
- Engageny Math
- McGraw Hill My Math
- enVision Math
- 180 Days of Math
- Math in Focus Answer Key
- Math Expressions Answer Key
- Privacy Policy
Go Math Grade 1 Answer Key Chapter 10 Represent Data
Go math grade 1 chapter 10 answer key represent data, represent data show what you know.

Represent Data Vocabulary Builder

Represent Data Game Graph Game
- Put 1 cube of that color in the correct row of your graph.
- Take turns. Play until each partner has 5 turns.
- The player who went last spins again to get a color.

Represent Data Vocabulary Game

- Choose a secret word from the Word Box. Do not tell the other players.
- Set the timer.
- Draw pictures to show clues for the secret word.
- The first player to guess the word before time runs out gets 1 point.
- Take turns.

The Write Way Reflect Choose one idea. Draw and write about it.
- Tell the difference between a picture graph and a bar graph.

Lesson 10.1 Read Picture Graphs
Essential Question What do the pictures in a picture graph show? Answer : A picture graph is a pictorial display of data with symbols, icons, and pictures to represent different quantities. The symbols, icons, and pictures of a picture graph typically represent concepts or ideas, or stand in for a larger quantity of something. … They used pictures known as hieroglyphics to convey a message

MATHEMATICAL PRACTICES Represent Describe how you can use your picture to compare the cubes. Answer: From the above picture we can notice the number of blue and green cubes Number of blue cubes = 4 Number of green cubes = 2 Number of blue cubes more than green cubes = 4 – 2 = 2 Therefore, 2 more blue cubes .

Share and Show

On Your Own

Problem Solving • Applications

TAKE HOME ACTIVITY • Keep track of the weather for one week by drawing a picture each day to show if it is sunny, cloudy, or rainy. At the end of the week, ask your child what the weather was like for most of the week.
Read Picture Graphs Homework & Practice 10.1

Question 4. WRITE Use numbers and pictures to show why a row with 6 smiley faces has one more than a row with 5 smiley faces. Answer: 6 rows has one row more than 5 rows because 6 is greater than 5 by 1 Explanation : As given a row of 6 Smileys…
its pretty obvious why it is 1 more it is shown below
🙂 this is the row of 6 🙂 This is 5
🙂 🙂
🙂 🙂
🙂 <– This is the the one smiley that shows the answer .

Question 4. Count forward. What number is missing? Write the number. 110, 111, 112, ___, 114 Answer: 110 , 111 , 112 , 113, 114 Explanation: Above sequence is in count by one . that means each ones place number is increased by 1 in ones place.
Lesson 10.2 Make Picture Graphs
Essential Question How do you make a picture graph to answer a question?
Listen and Draw

Model and Draw

Question 7. Did all your classmates make picture graphs that look the same? Circle yes or no. Answer: No, children choices are different .

TAKE HOME ACTIVITY • Ask your child to make a picture graph showing how many glasses of water each family member drinks in a day. Discuss how to find who drinks the most water.
Make Picture Graphs Homework & Practice 10.2

Problem Solving Question 3. Write your own question about the graph. ___________________ ____________________ Answer: How many more Tyrannosaurus are chosen than Apatosaurus ?
Question 4. WRITE Write a question that can be answered by making a picture graph. Answer: How many more Tyrannosaurus are chosen than Apatosaurus ? Explanation : Number of children choose Tyrannosaurus = 5 Number of children choose Apatosaurus = 3 Number of more Tyrannosaurus are chosen than Apatosaurus = 5 – 3 = 2

Spiral Review Question 3. Write is the sum. 6 + 3 = _____ Answer: 6 + 3 = 9
Question 4. Write the difference. Write how many tens. 60 – 20 = _____ _____ tens Answer: 60 – 20 = 40 4 tens .
Lesson 10.3 Read Bar Graphs
Essential Question How can you read a bar graph to find the number that a bar shows?

MATHEMATICAL PRACTICES Apply Describe how the class made this picture graph. Answer: The class made the picture graph of Type of sneaker we are wearing with laces and no laces. Each circle represents one child. Number of children with laces = 10 Number of children with no laces = 5
Question 13. GO DEEPER Ed adds a row to the graph to show jackets with snaps. 2 fewer jackets have snaps than have zippers. How many jackets have snaps? ______ jackets Answer: 3 Jackets Explanation : Number of zippers = 5 Number of snaps = ? 2 fewer jackets have snaps than have zippers Number of snaps = 5 – 2 = 3 snaps .
TAKE HOME ACTIVITY • Have your child look through newspapers and magazines for examples of bar graphs. Talk about what information is shown in each graph you find.
Read Bar Graphs Homework & Practice 10.3

Question 4. WRITE Use numbers and pictures to compare two items in a bar graph. Answer:

Spiral Review Question 2. Write a subtraction sentence you can solve by using 9 + 7 = 16. ___ – ____ = ____ Answer: 9 + 7 = 16 16 – 7 = 9 16 – 9 = 7
Lesson 10.4 Make Bar Graphs
Essential Question How does a bar graph help you compare information? Answer : Bar graphs are used to compare things between different groups or to track changes over time. However, when trying to measure change over time, bar graphs are best when the changes are larger.
MATH EMATICAL PR ACTICES
Model How do you know that you counted each food in the picture? Answer: From the given figure we know the Number of pizzas = 3 Number of hot dogs = 5 Number of tacos = 4 The same counted food is represented the bar graph by marking the graph up to the quantity number .

TAKE HOME ACTIVITY • Your child has learned how to make picture graphs and bar graphs. Ask your child to explain how bar graphs are different from picture graphs.
Make Bar Graphs Homework & Practice 10.4

Question 2. How many children chose breakfast? _____ children Answer: Number of children choose breakfast = 5
Question 3. Which meal was chosen by the most children? __________ Answer: The breakfast meal was chosen by the most children
Problem Solving Question 4. What if 10 children chose breakfast? How many children could choose lunch or dinner? _______ children Answer: Total number of students = 10 Number of children chosen breakfast = 10 Remaining number of children = 10 – 10 = 0 So, No children left to choose lunch and dinner .
Question 5. WRITE Use words and pictures to show how to make a bar graph about favorite storybooks. Answer:

Represent Data Mid-Chapter Checkpoint
Concepts and Skills

Question 2. How many children wear glasses? ______ Answer: Number of children wear glasses = 2

Number of children choose car =4 Number of children choose bus = 8 More children choose bus not car .
Number of children choose car = 4 Number of children choose bike = 1 Fewer children go by bike than by car. is true
Lesson 10.5 Read Tally Charts
Essential Question How do you count the tallies on a tally chart? Answer : Tally marks are a quick way of keeping track of numbers in groups of five. One vertical line is made for each of the first four numbers; the fifth number is represented by a diagonal line across the previous four

MATHEMATICAL PRACTICES Reasoning How did you sort the counters? Answer: Number of pink crayons = 10 Number of yellow crayons = 8 as in above figure , 10 circles are represented in first column of pink as we have 10 pink crayons 8 circles are represented in second column of yellow as we have 8 Yellow crayons

Question 2. How many boys are in the class? _____ boys Answer: Number of boys in a class = 9
Question 3. How many children are in the class in all? ______ children Answer: 15 children Explanation : Number of boys in a class = 9 Number of girls in a class = 6 Total Number of children are in the class in all = 9 + 6 = 15
Question 4. Are there more boys or girls in the class? __________ Answer: More boys in a class Explanation : Number of boys in a class = 9 Number of girls in a class = 6 we have more number of boys

TAKE HOME ACTIVITY • Together with your child, make a tally chart showing how many times you all say the word “eat” during a meal. Then have your child write the number.
Read Tally Charts Homework & Practice 10.5

Question 4. Write the sum. 34 + 40 = ______ Answer: 34 + 40 = 74
Lesson 10.6 Make Tally Charts
Essential Question Why is a tally chart a good way to show information that you have collected?

MATHEMATICAL PRACTICES Analyze How do you know which game is the favorite? Answer: Board game Explanation : Number of children choose card game = 5 Number of children choose puzzle game = 3 Number of children choose board game = 10 The most children like board game

Question 10. Predict. Which subject will children least likely choose? Answer: Both Reading and science Explanation : Number of children like math = 6 Number of children like reading = 2 Number of children like science = 2 Both science and reading is chosen by same number of children .
Question 11. THINK SMARTER How can you prove if your prediction is good? Try it. Answer: Prediction will be good only if the children gives the same response as the prediction done in the tally results .

TAKE HOME ACTIVITY • With your child, survey friends and family to find out their favorite food. Draw tally marks to record the results and then prepare the food.
Make Tally Charts Homework & Practice 10.6

Question 2. How many children chose blue? ______ children Answer: Number of children choose blue = 6

Question 4. Predict. Which game will children least likely choose? ____________ Answer: tag Explanation : Number of children like tag = 1 Number of children like kickball = 7 Number of children like hopscotch = 2 Therefore, number of children least likely choose tag .
Question 5. WRITE Write a question that can be answered by making a tally chart. Answer: How many more children like kickball than tag . Answer : 6 more children Explanation : Number of children like tag = 1 Number of children like kickball = 7 Number of more children like kickball than tag = 7 – 1 = 6

Lesson 10.7 Problem Solving • Represent Data
Essential Question How can showing information in a graph help you solve problems?

HOME CONNECTION • Your child learned how to represent data from a picture in a bar graph. Have your child explain why it is easier to use data in a bar graph than in a picture.
Try Another Problem

MATHEMATICAL PRACTICE Make Connections Find out about the eye color of your classmates. Question 3. Write a question you can ask your friends. Answer: The eye color of your 5 classmates are been asked. 3 classmates have eye color black and Remaining classmates have brown color. find how many classmates have brown color. Explanation : Number of classmates = 5 Number of classmates with black eye color =3 Number of classmates with brown color eye = 5 – 3 = 2

Question 6. Explain What did you learn from the graph? Answer: The graph explain about the favorite ice cream flavor Number of children like Vanilla = 3 Number of children like Butter scotch = 4 Number of children like Chocolate = 5

Question 8. GO DEEPER How many children chose bananas? _____ children Answer: 12 children Explanation : Total number children were asked = 20 Number of children choose apple = 3 Number of children choose grapes = 9 Number of children choose banana = 20 – 3 – 9 = 12
Question 9. THINK SMARTER+ Write another question that can be answered by using the graph. Answer: How many more number of children chosen grapes than apple ? Answer : 6 more children Explanation : Number of children choose apple = 3 Number of children choose grapes = 9 Number of more children chosen grapes than apple = 9 – 3 = 6
TAKE Home Activity • Work with your child to make a tally chart and a bar graph showing the favorite color of 10 family members or friends. Talk about the results.
Problem Solving • Represent Data Homework & Practice 10.7

Question 2. How many friends chose soccer or basketball? ______ friends Answer: 3 friends Explanation : Number of friends choose soccer = 6 Number of friends choose basket ball = 3

Represent Data Review/Test

Question 6. Ann says the graph shows 1 more rainy day than cloudy days. Is she correct? Choose Yes or No. Yes No Explain your answer Answer: No, Explanation : Number of cloudy days = 12 Number of rainy days = 11 Number of cloudy days are more So, it should be one more cloudy day than rainy day .

Question 12. Write another question that can be answered by Chung’s graph. Answer: How many more animals seen elephants or lions: Answer : Elephants Explanation : Number of lions seen = 2 Number of elephants seen = 4 + 2 = 6 elephants are seen more
Leave a Comment Cancel Reply
You must be logged in to post a comment.
IMAGES
VIDEO
COMMENTS
How we can solve problems by using the information in a graph, table, or chart, comparing amounts to answer questions, writing number sentences (equations) f...
Unlock the Problem What do I need to find? how many Ava has What information do I need to use? the number of , , and in the picture Show how to solve the problem. Use the graph. Write how many. Add to solve. 1. 4 1 1 5 How many beads does Ava have? beads Lesson 10.7 Reteach Chapter Resources 10-17 Reteach
Lesson: 7 Problem Solving • Represent Data. Lesson 10.7 Problem Solving • Represent Data - Page(611-616) Problem Solving • Represent Data Homework & Practice 10.7 - Page(615-616) Represent Data Review/Test - Page(617-620) Represent Data Show What You Know. Make a Concrete Graph Question 1. How many ☐ are there? _____ Answer: There ...
Problem Solving • Represent Data Essential Question How can showing information in a graph help you solve problems? Lesson 10.7 PROBLEM SOLVING What do I need to fi nd? What information do I need to use? Show how to solve the problem. how many animals Brad sees the number of rabbits, birds , and deer in the picture + 3 — 6 —+ 2 — = 11 ...
Practice and Homework. Lesson 10.7. COMMON CORE STANDARD—1.MD.C.4. Represent and interpret data. Problem Solving • Represent Data. Bella made a tally chart to show the favorite sport of 10 friends. Use the graph to solve. Use the tally chart to make a bar graph. Chapter 10 six hundred fifteen615.
Each lesson covers a different standard, gives the objective, new vocabulary words that were introduced, and a video that explains the homework sheet. I hope this is helpful to my classroom as well as others! ... Lesson 10.7- Problem Solving- Represent Data Essential Question: How can showing information in a graph help you solve problems?
This covers pages 612 and 615. Yes, I skip around a bit today. There is no Math on the Spot video. Please submit both pages in ClassDojo.
Recorded with https://screencast-o-matic.com
Problem Solving • Represent Data Essential Question How can showing information in a graph help you solve problems? Lesson 10.7 PROBLEM SOLVING What do I need to find? What information do I need to use? Show how to solve the problem. how many animals Brad sees the number of rabbits , birds , and deer in the picture — 1 — 1 — 5 — animals
Go Math! - Chapter 10: Represent Data by Heather Bly | This newsletter was created with Smore, an online tool for creating beautiful newsletters for educators, nonprofits, businesses and more ... Lesson 10.7- Problem Solving: Represent Data; zoom_out_map . Animated Math Models-Practice some of your math skills with Curious George! Lesson 10.1 ...
Lesson 10.1 Write a number sentence to solve the problem. Use the picture graph at the top of the page. Chapter 10 one hundred seventy-nine P179 ... Problem Solving • Represent Data Bella made a tally chart to show the favorite sport of 10 friends. Use the graph to solve.
Lesson 10.5 Read Tally Charts Lesson 10.6 Hands On: Make Tally Charts Lesson 10.7 Problem Solving: Represent Data Instructional Focus Documents Go Math K-5 Guidance Documents Vocabulary: graph, data, category, more, less, horizontal, vertical, picture graph, bar graph, tally chart, tally mark, count, compare, shorter, longer
Lesson Topic Standard Days HW Notes OPERATIONS AND ALGEBRAIC THINKING ADDITION CONCEPTS Show What You Know 1.1 Algebra: Use a Picture to Add To CC.1.OA.1 1 ... 10.7 Problem Solving: Represent Data CC.1.MD.4 1 Review CC.1.MD.4 1 Assessment 1 Chapter 11: 8 Days Lesson Topic Standard Days HW Notes GEOMETRY THREE-DIMENSIONAL GEOMETRY
Unit 5 -- Chapter 10: Represent Data Examples from each lesson Lesson 10.1 More information on this strategy is available on Animated Math Model #43. Lesson 10.2 ... Problem Solving Represent Data Ava has these beads to make a bracelet. How can you find how many beads she has? 0 0 a Ono Unlock the Problem .
About Press Copyright Contact us Creators Advertise Developers Terms Privacy Policy & Safety How YouTube works Test new features NFL Sunday Ticket Press Copyright ...
3.9 Problem Solving: Numbers to 9 Chapter 3 Review/Test Performance Task Chapter 4 Represent and Compare Numbers to 10 4.1 Hands On: Model and Count 10 4.2 Count and Write 10 4.3 Hands On: Algebra • Ways to Make 10 4.4 Count and Order to 10 Mid-Chapter Checkpoint 4.5 Problem Solving: Compare by Matching Sets to 10 4.6 Compare by Counting Sets ...
Go Math! - Chapter 10: Represent Data by Heather Bly | This newsletter was created with Smore, an online tool for creating beautiful newsletters for educators, nonprofits, businesses and more ... Solve problem situations using the strategy make a graph. ... Lesson 10.1- Read Picture Graphs; Lesson 10.2- Hands On: Make Picture Graphs;
This FIRST GRADE product was created as a companion to the GoMath Curriculum. This resource is an UNOFFICIAL companion and is NOT endorsed by Houghton Mifflin. I have used Chapter 10 - Represent Data, as a guide in creating these math centers. Lesson numbers are included in the centers to help guide your usage of the centers with your students.
The city of Raleigh has 9500 registered voters. There are two candidates for city council in an upcoming election: Brown and Feliz. The day before the election, a telephone poll of 350 randomly selected registered voters was conducted. 112 said they'd vote for Brown, 207 said they'd vote for Feliz, and 31 were undecided.
Go Math 1st Grade Answer Key Chapter 10 Represent Data 10.7 6. Leave a Comment / By Prasanna / February 23, 2021 . Post navigation. ... McGraw Hill Math Grade 4 Chapter 13 Lesson 5 Answer Key Subtracting Angle Measures ...
10.7. Operations and Algebraic Thinking—. 4.OA.C.5. MATHEMATICAL PRACTICES. MP4, MP7, MP8. Unlock l t the Problem l. You can find patterns in fabric, pottery, rugs, and wall coverings. You can see patterns in shape, size, position, color, or number of figures. Sofia will use the pattern below to make a wallpaper border.
Answer: Explanation : Number of children choose zebras = 5 Number of children choose seals = 1 Total Number of children choose zebras and seals = 5 + 1 = 6. Question 12. Answer: Explanation : Number of children choose lions = 8 Number of children choose seals = 1 Number of more children choose lion than seals = 8 - 1 = 7.
This lesson uses the strategy "Act It Out" to solve problems involving patterns.